Vietnam had always been on my bucket list, but we hadn’t planned to visit it anytime soon. However, as 2024 drew to a close, perhaps inspired by the spirit of “revenge travel” or a spur-of-the-moment decision, we decided to make it happen—just in time. Our hectic work and travel schedules in November and December had left little room for early planning, but the allure of Vietnam proved irresistible, and we finally set our sights on this incredible destination.
This destination was initially tagged as a “plan-it-yourself” trip, but the last-minute nature of our decision made us turn to a holiday agent—MakeMyTrip. They were highly responsive and efficiently planned the key attractions for us, ensuring we didn’t miss the important highlights.
We managed to get our e-VISA just in time, though we were already considering a Plan B. The process typically takes 5-8 days and requires specific documents: a scanned, colored copy of the passport’s front and back pages with at least six months of validity, a recent photo (35 x 45 mm) with a white background (no visible teeth or glasses), and a PDF of the round-trip tickets. While it was a scramble, the heavy lifting and follow-up were expertly handled by the MakeMyTrip VISA team, leaving us with nothing to do but worry and wait.
While there are direct flights available, our last-minute travel plans meant we had to reach Hanoi with a layover in Bangkok.
Day 1: Hanoi – Where the Old Meets the New
We stayed at the Hanoi Daewoo Hotel, situated at 360 Kim Ma Street in the Ba Dinh District. The hotel provided a peaceful retreat in the heart of the city. Although it isn’t located directly in Hanoi’s bustling Old Quarter—approximately 4 to 5 kilometers away in the Hoàn Kiếm District—it offers convenient access to key attractions. A quick Grab ride, typically 15 to 20 minutes, easily takes you to the Old Quarter. After a tiring overnight journey with a layover in Bangkok, we were eager to rest yet excited to start exploring Hanoi.
Lotte Center Skydeck

Since we couldn’t get an early check-in, we started our day by visiting the Lotte Center Skydeck, conveniently located near the Hanoi Daewoo Hotel. The Skydeck offers breathtaking panoramic views of the city and is a must-visit for its stunning scenery. The highlight is the Skywalk, a glass-floored section that provides a thrilling experience and a unique perspective of Hanoi. Additionally, there are coffee shops where you can enjoy a classic Vietnamese coffee (more on that later) and some VR games that entertain the kids and add to the fun for everyone.
Hanoi Train Street
After visiting the Skydeck, checking into our room, and enjoying lunch at the hotel, we headed to Hanoi’s Train Street (HTS). Online, we found out there was a train scheduled at 3:30 PM. HTS is a unique and thrilling attraction where a narrow residential street comes alive as a train passes just inches away from homes and cafes. Lined with colorful buildings and bustling with local life, it’s a fascinating place to watch the train squeeze through while sipping Vietnamese elixirs (coffee, beer) and munching Vietnamese food from one of the cozy cafes. This blend of daily life and adventure makes it a must-see in Hanoi.
Unfortunately, we missed the 3:30 PM train due to traffic, and by the time we arrived, it had already passed. Determined not to miss the experience, we tried again on another night, and the photo we captured was of the nighttime train. The atmosphere was electrifying as the train approached—the warning bell rang, shopkeepers hurriedly moved their chairs indoors, guards cleared people off the tracks, and some even placed beer bottle caps on the rails to flatten them as the train sped by. When the train finally roared past, the crowd erupted in cheers and applause, awestruck by the thrilling spectacle.
If you’re wondering whether to visit this place during the day or at night, I’d highly recommend going at night! The glowing lanterns and the lively, international noisy crowd make it a truly magical experience. Be sure to check the train schedule in advance or ask the café owners for timings. One café owner told us there was a train at 8:30 PM, but the train we ended up seeing arrived at 9:00 PM. Initially, we thought it was a ploy to keep us there longer to eat, drink, and spend more, but it turned out to be worth the wait!
Lotte Aquarium
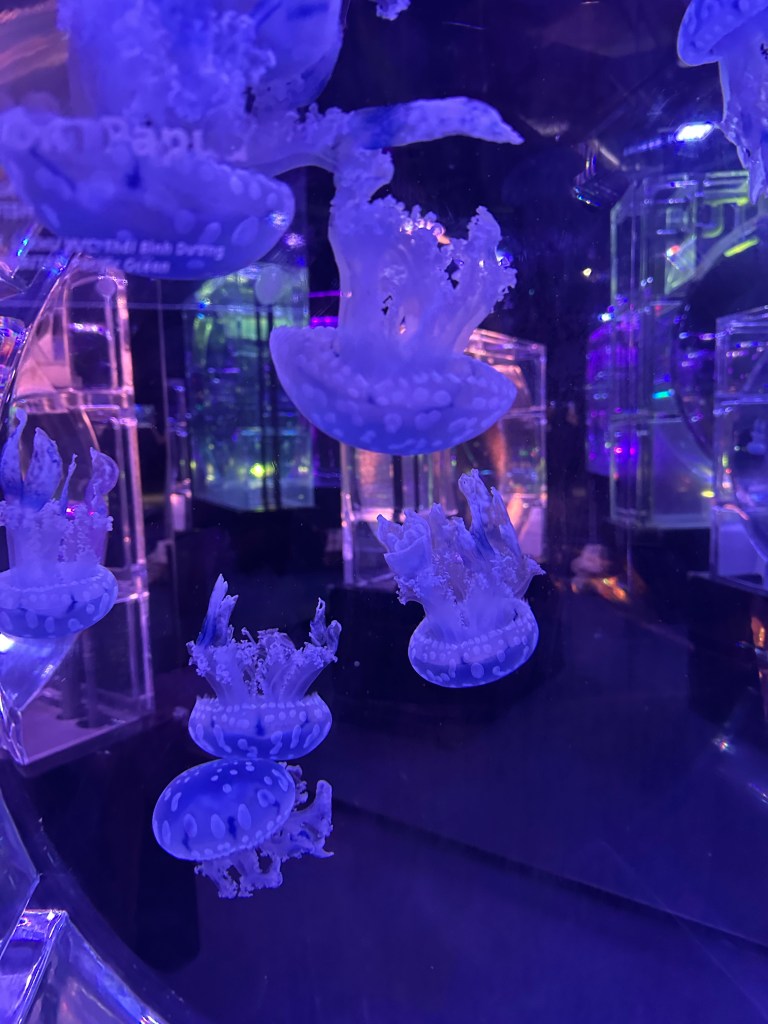
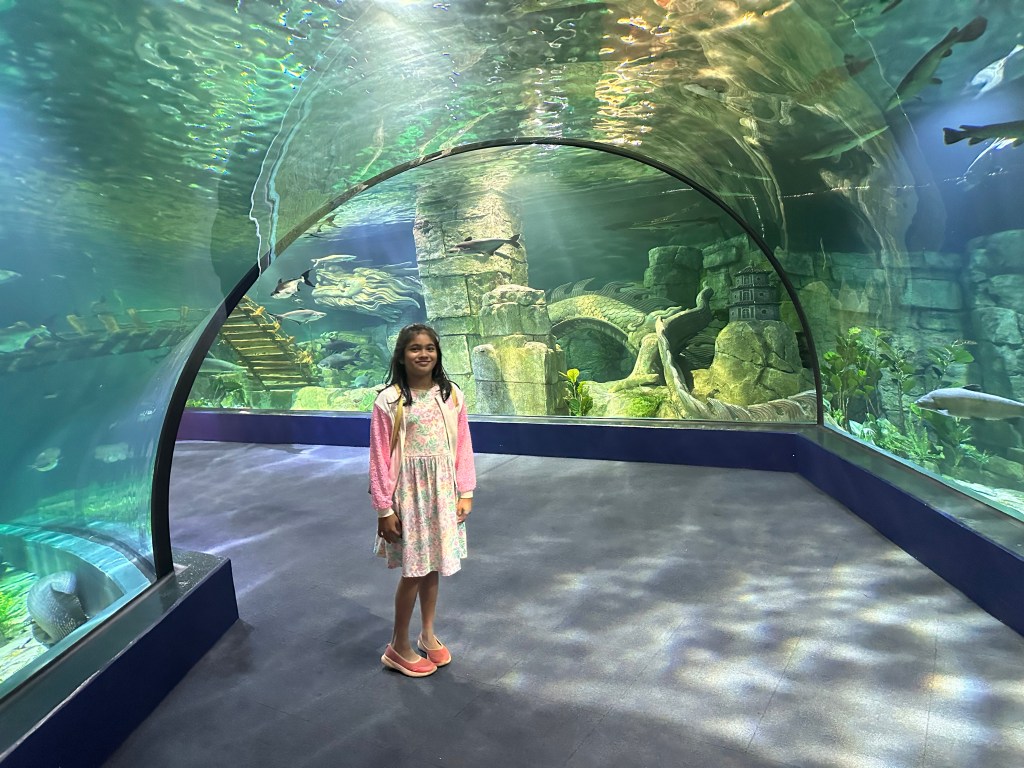
After visiting Hanoi Train Street (HTS), we headed to the Lotte Aquarium, having purchased a combined ticket for both the Skydeck and the aquarium. Located within the Lotte Center near West Lake, just a 20-minute drive from the Daewoo Hotel, this modern aquarium is an excellent destination for families. It offers an immersive experience showcasing diverse marine life, from vibrant coral reefs to mesmerizing jellyfish displays. A highlight for my child was participating in pearl harvesting, where she watched a pearl oyster being opened to reveal a pearl, which could then be crafted into jewelry. She also enjoyed the hands-on experience of touching marine creatures like shellfish, crabs, and starfish. The aquarium fosters a magical connection with the underwater world, making it a fun and educational outing for all ages!


The Dinner Disaster
The food in Vietnamese malls and hotels is predominantly non-vegetarian, with beef and pork being common ingredients. Both my wife and I stick to seafood and chicken but avoid red meat, while my daughter eats eggs and is just starting to experiment with chicken—though she won’t go near seafood or red meat. This made finding suitable food in the malls quite challenging, as most dishes contained beef or pork. In the end, we settled for ice cream instead.
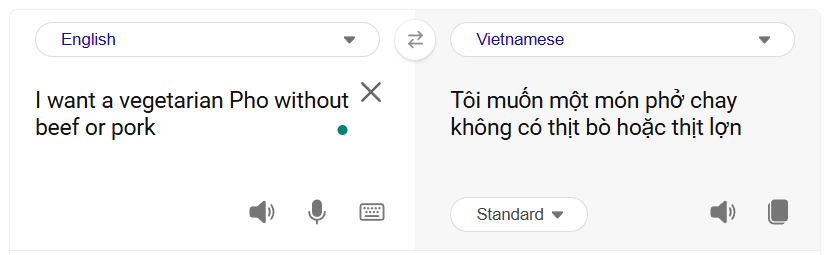
Communication in Vietnam posed another challenge, as English is not widely spoken or understood. We quickly adapted by using Google Translate to communicate, a skill we relied on heavily. The girls were eager to try the iconic Vietnamese Pho, but given the limitations, we returned to our hotel and ordered chicken and vegetarian Pho instead as part of the dinner buffet. 80% of the buffet was out of reach!
Day 2: Ha Long Bay – Nature’s masterpiece
The day-long trip to Ha Long Bay began early, with a 7:30 AM meeting time at a designated point (for us, it was the Hanoi Opera House). A car transported us from our hotel to the meeting point, and punctuality was key—everyone adhered to the schedule, with a call from the driver/guide, 10 minutes in advance to ensure we were ready. From the meeting point, buses or limousines carried passengers to Halong Bay. At each stop, tour guides stepped off the bus to locate their assigned travelers, calling out names, scanning faces, and matching passengers with their groups—a lively process that felt like a cheerful treasure hunt.
The journey to Halong Bay shared with strangers (an international crowd from Japan, Taiwan, Mainland China, Australia, France, India, Germany, South Africa, and Jamaica), made for a lively and engaging travel experience. The tour guides, brimming with humor and charm, kept us entertained with amusing anecdotes, intriguing historical tidbits, and a detailed overview of the day’s itinerary. Their lively storytelling added a unique touch to the ride, making it both informative and enjoyable. However, when the tour guide took a break from narrating, the bus quickly fell into a peaceful silence as most passengers drifted off to sleep.
Cruise & Lunch

After a 2.5-hour drive, with a couple of planned and emergency pit stops, we arrived at Tuan Chau Harbor to board the boat and began our excursion exploring the stunning beauty of this UNESCO World Heritage Site. Onboard, we enjoyed a set menu lunch featuring a variety of Halong’s special dishes. Passengers were seated based on their dietary preferences, which ranged from vegan and vegetarian to non-vegetarian with specific preferences like eggs, beef, pork, or seafood. The guide carefully arranged seating to prevent conflicts, especially avoiding solo travelers claiming the best spots—a surprising number of whom were on the trip.
The food was excellent, and my wife and I opted for the seafood menu, which was a highlight for us. However, my daughter didn’t enjoy the vegetarian options and decided to rely on chips and chocolate for the rest of the day. Even that proved tricky, as many snacks in Vietnam are flavored with pork, beef, or seafood, making her scrutinize every label carefully before digging in.
TiTop Island


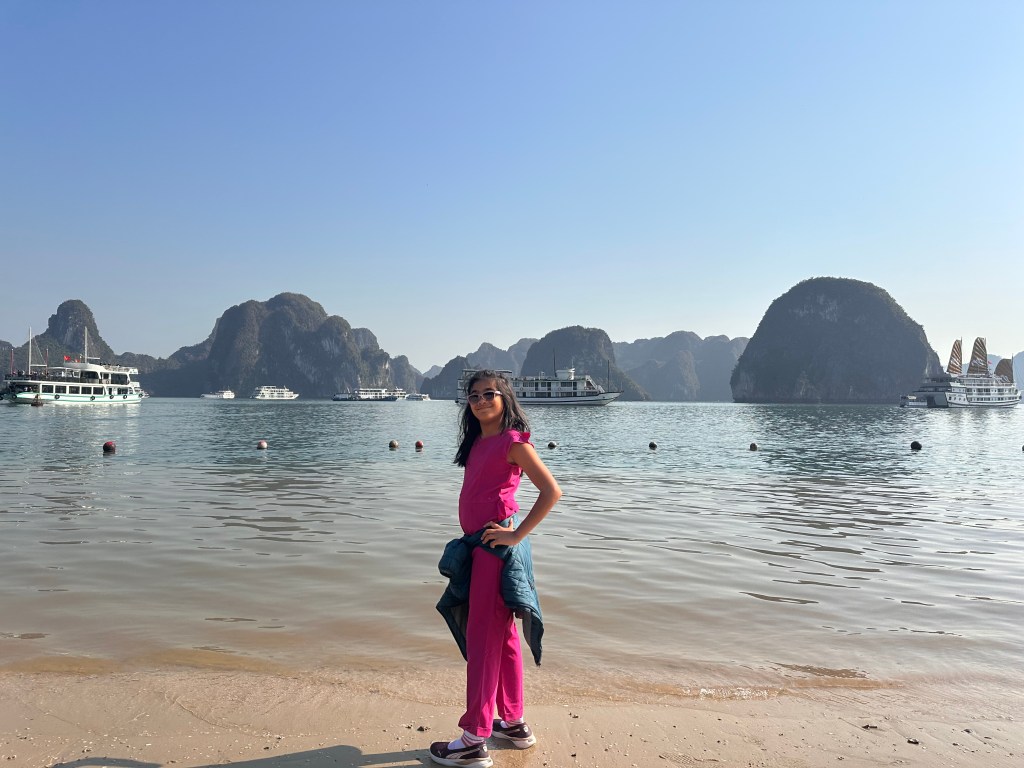


After lunch, we headed up to the deck to enjoy the stunning views of the islands and capture some photos. Our next stop was TiTop Island, where visitors could choose to swim or hike to the top for the best view. We opted for the trek, eager to take in the panoramic scenery. Each limestone island in Halong Bay is uniquely named based on its appearance, such as Chicken Island, adding to the charm of the experience. The hike to the top was steep, with over 500 steps, but the mesmerizing view made every step worth it. At the summit, we treated ourselves to refreshing coconut water, snapped some memorable pictures, and soaked in the breathtaking landscape before heading back down to rejoin the cruise.
Luan Cave


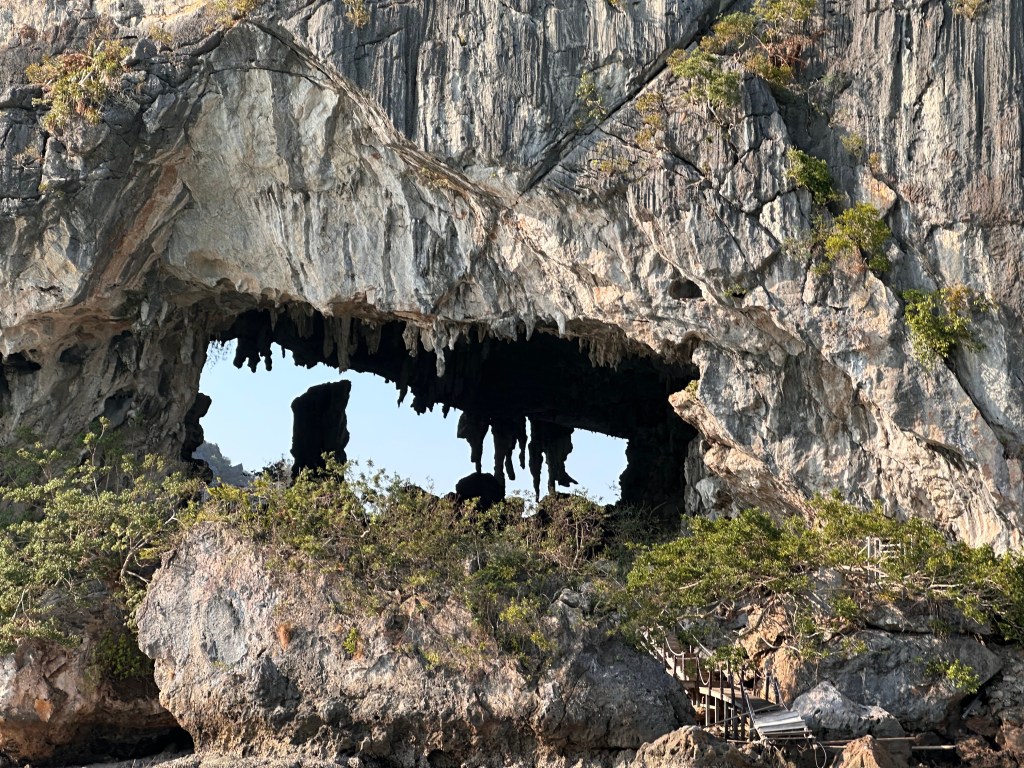
Our first stop after the hike was Luon Cave, located on Bo Hon Island. The area surrounding Luon Cave is rich with well-known attractions in Halong Bay, making it a hub of natural beauty. Directly in front of the cave is Turtle Island, while Heaven Gate lies to its right, adding to the picturesque setting.
Visitors have several options to explore Luon Cave: paddling through its waters by kayak, gliding on a traditional bamboo boat, or opting for a speedboat tour to see nearby attractions. We chose the speedboat, and it turned out to be an exhilarating experience. The driver skillfully maneuvered the boat, creating an adrenaline rush as we sped across the water. Along the way, our guide pointed out fascinating landmarks like Dragon Cave, Stone carved Lotus, and Mermaid, each adding a touch of wonder to the journey. It was a thrilling and memorable way to experience the beauty of Halong Bay.
Sung Sot Cave


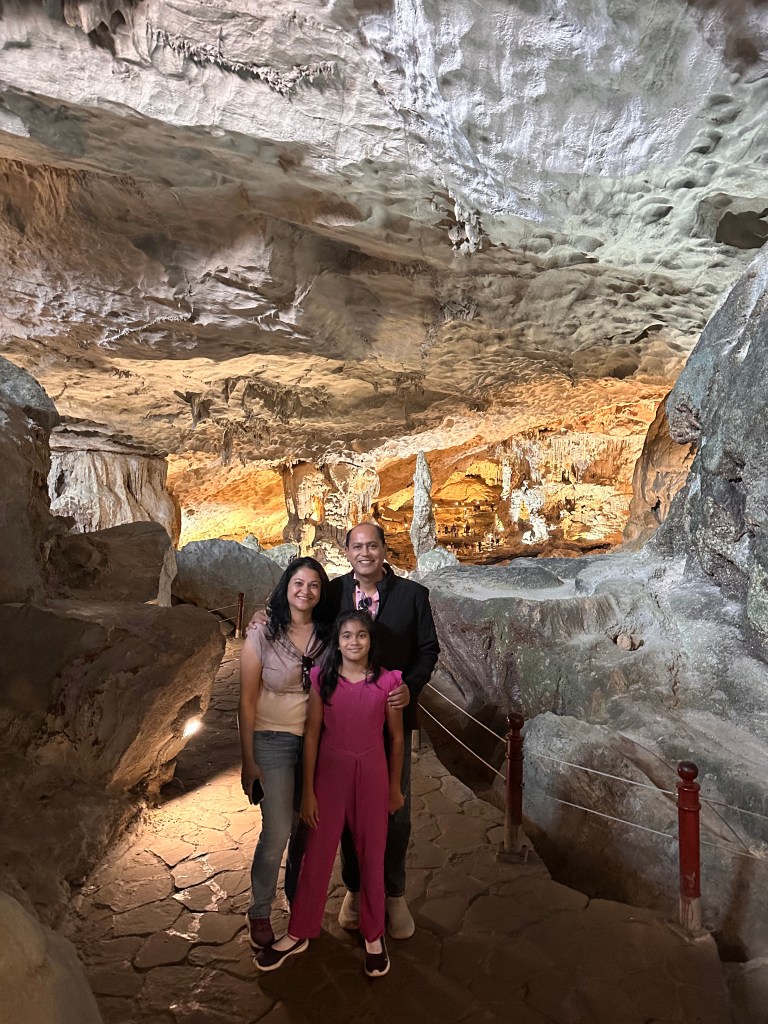

Our next destination was the famous Sung Sot Cave, or the “Surprising Cave,” located on Bo Hon Island. As we approached, our tour guide shared fascinating details about the cave’s history and its unique features, preparing us for the experience. However, we were greeted by a long line of eager tourists—proof of the cave’s popularity as one of Halong Bay’s must-see attractions. Sung Sot Cave is a natural marvel, consisting of three chambers: a small entry chamber, a middle chamber, and an expansive, grand chamber that lives up to its name. Spanning a 2-kilometer walk, the cave is adorned with stunning stalagmites and stalactites that have been shaped over millennia by dripping water and time. The formations take on fascinating shapes and textures, sparking the imagination as you stroll through the illuminated path. The grand chamber, the highlight of the cave, is particularly breathtaking, with its vast space and dramatic formations. It’s no wonder the cave is named “Surprising”—its sheer scale and beauty leave visitors awestruck. Despite the crowd, the experience was well worth it, as we explored one of the most beautiful caves in Halong Bay.
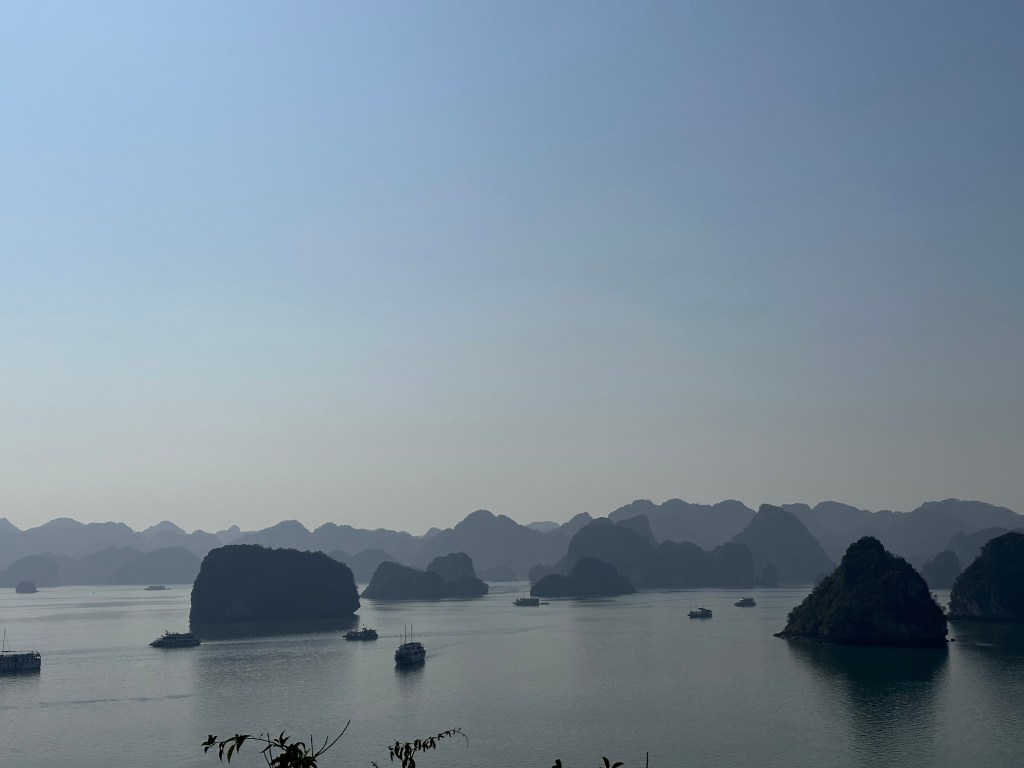
Sunset

The return to the harbor was serene, a perfect end to our day at Halong Bay. As the sun set, the golden light reflected on emerald waters, casting a warm glow over the limestone islands. A gentle breeze carried a sense of tranquility, washing away urban stress. Standing on the deck, surrounded by nature’s beauty, we felt a profound peace—a magical moment that makes Halong Bay unforgettable.
Day 3: Ninh Binh Tour
The day began even earlier than Day 2, as we prepared to meet a new group of strangers at a different meeting point. Our guide, Mr. Luca, was a bit of a newcomer to managing a large bus tour, having mostly handled smaller limousine groups before. The itinerary for the day included a 110 km drive filled with diverse activities planned by the tour team: a visit to a historic temple, a cycling adventure, a serene boat ride, and a trek through stunning landscapes.
Dinh King Temple

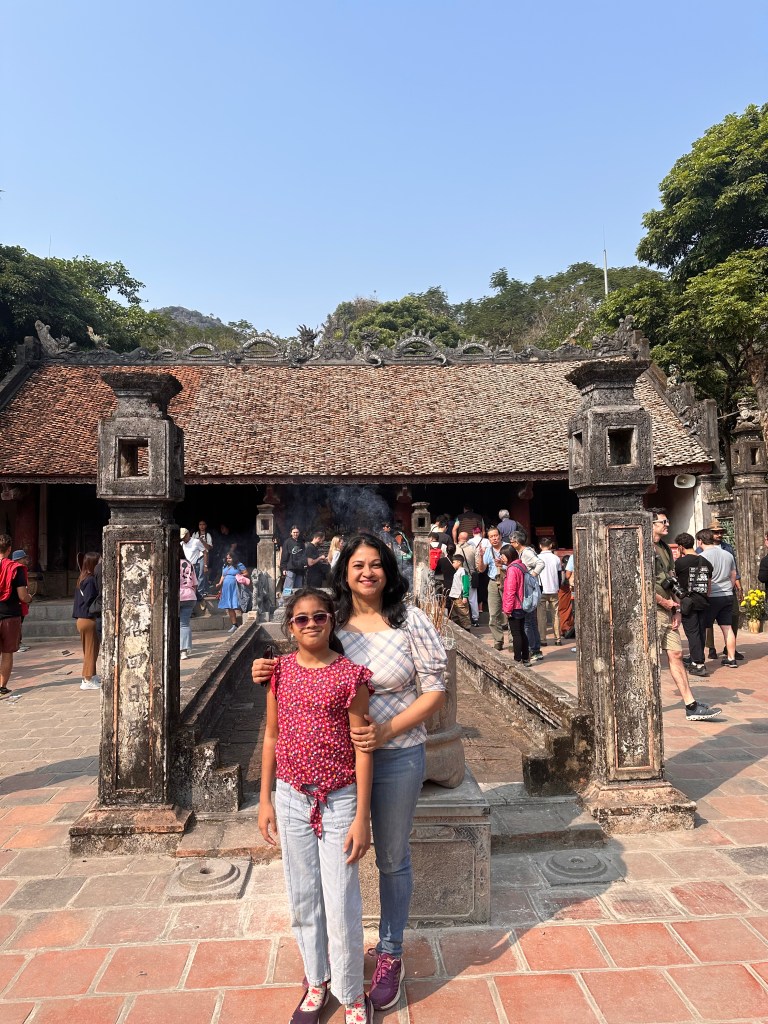

The first stop was a temple. The Dinh King Temple is located in the ancient capital of Hoa Lu and was built in honor of Emperor Dinh Tien Hoang, who founded the Dinh Dynasty in the 10th century. The temple reflects the spiritual depth of Vietnam’s early dynasties. Intricate carvings of dragons, phoenixes, and mythical creatures adorn the temple, symbolizing strength, prosperity, and protection.
Vietnamese culture has deep-rooted connections to kingship and spirituality, with temples serving as both places of worship and symbols of reverence for past rulers. The five elements—metal, wood, water, fire, and earth—play a significant role in traditional Vietnamese cosmology, representing harmony between humanity and the natural world. The Vietnamese people are believed to embody characteristics of these elements based on their birth year. These elements shape compatibility in relationships, especially marriage. For example, water nourishes wood, making individuals of these elements a harmonious match, while fire and water may clash.
Cycling and Lunch


Our second stop was for a short cycling tour followed by lunch. Cycling was a fun way to work up an appetite while exploring the land like traditional Vietnamese locals. However, the cycle was a bit too large for my daughter, so she decided to piggyback while I pedaled through the scenic route. She did try it when there was no traffic! Along the way, there were plenty of photographers (paparazzi) ready to capture the moment, making us feel like celebrities!
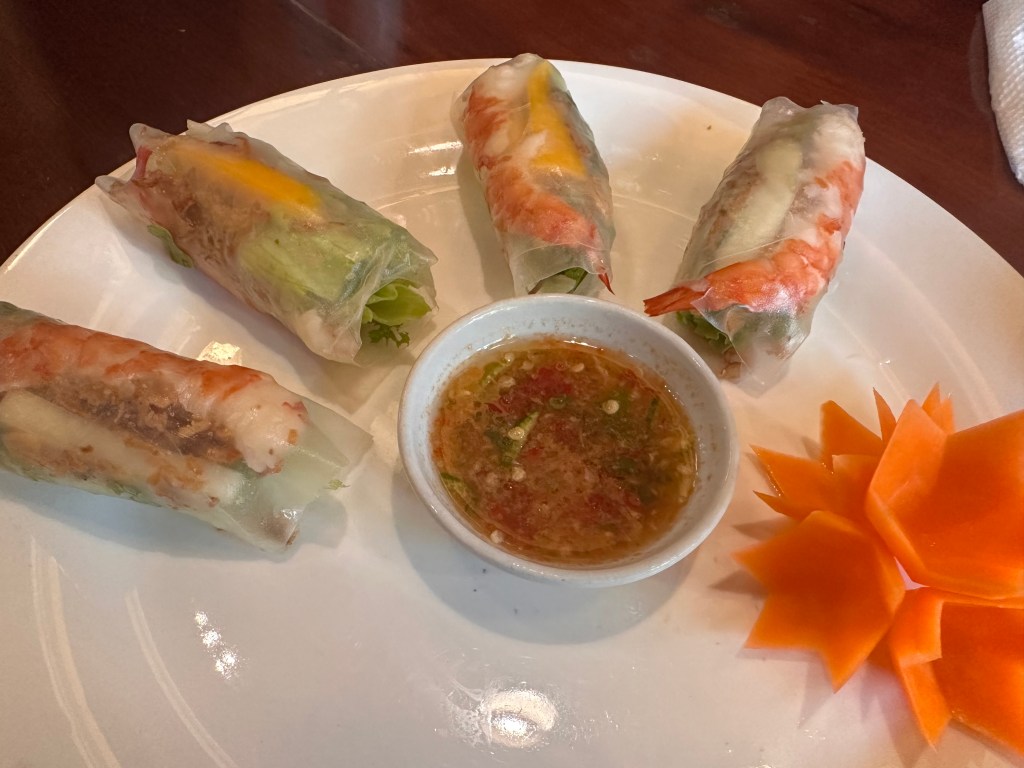
Exploring the countryside on a bicycle offered a unique perspective, reminiscent of our cycling adventure in the paddy fields of Bali. Though this tour was brief, lasting about 30 minutes, we spent a memorable time winding through peaceful villages. The activity got our metabolism going, and we rewarded ourselves with a delicious Vietnamese lunch. A highlight of the meal was the fresh spring rolls—thin rice paper wraps filled with vegetarian or other tasty fillings. Healthy, light, and full of flavor, they were a perfect treat after the ride.
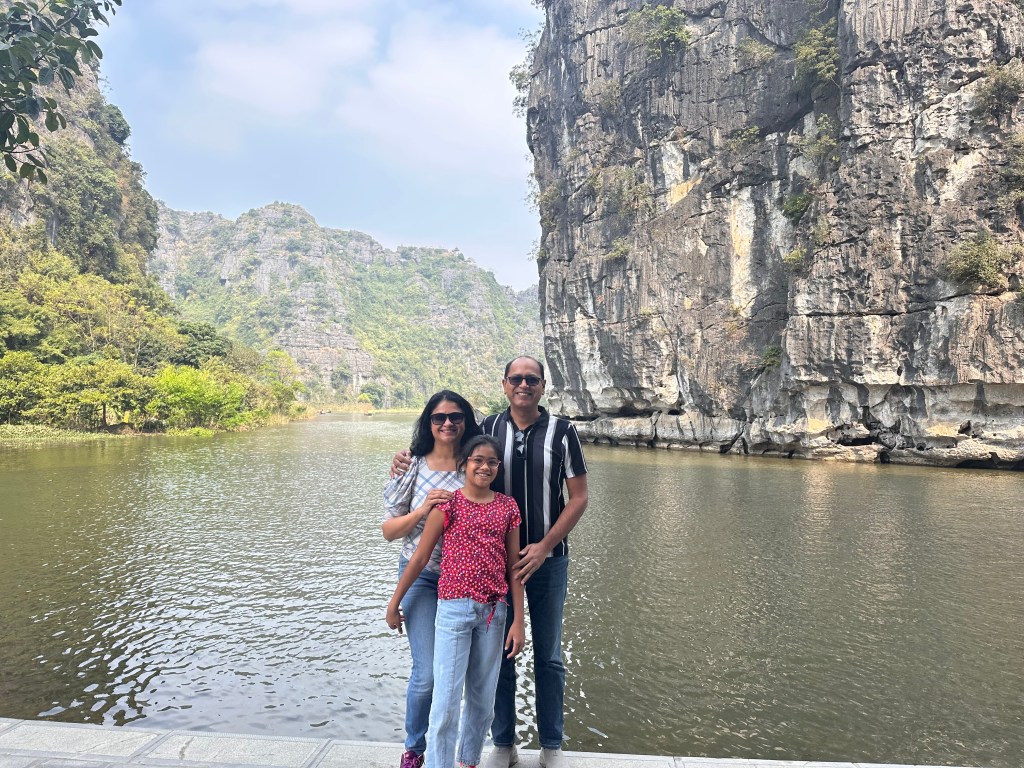
Trang An Grottoes
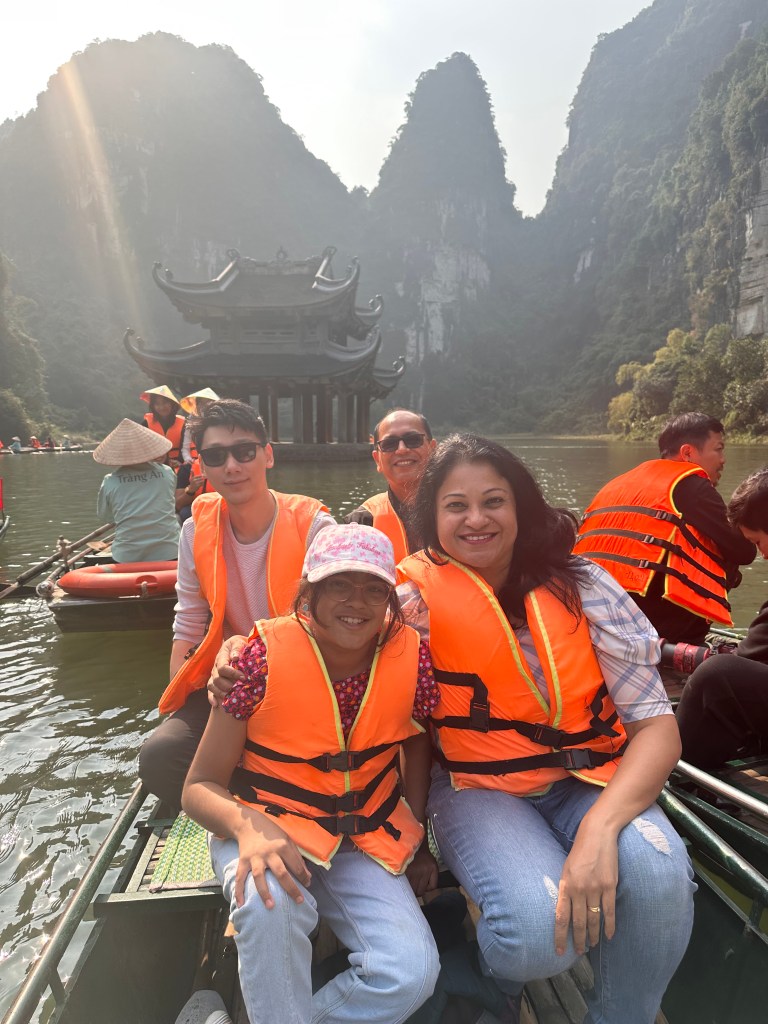
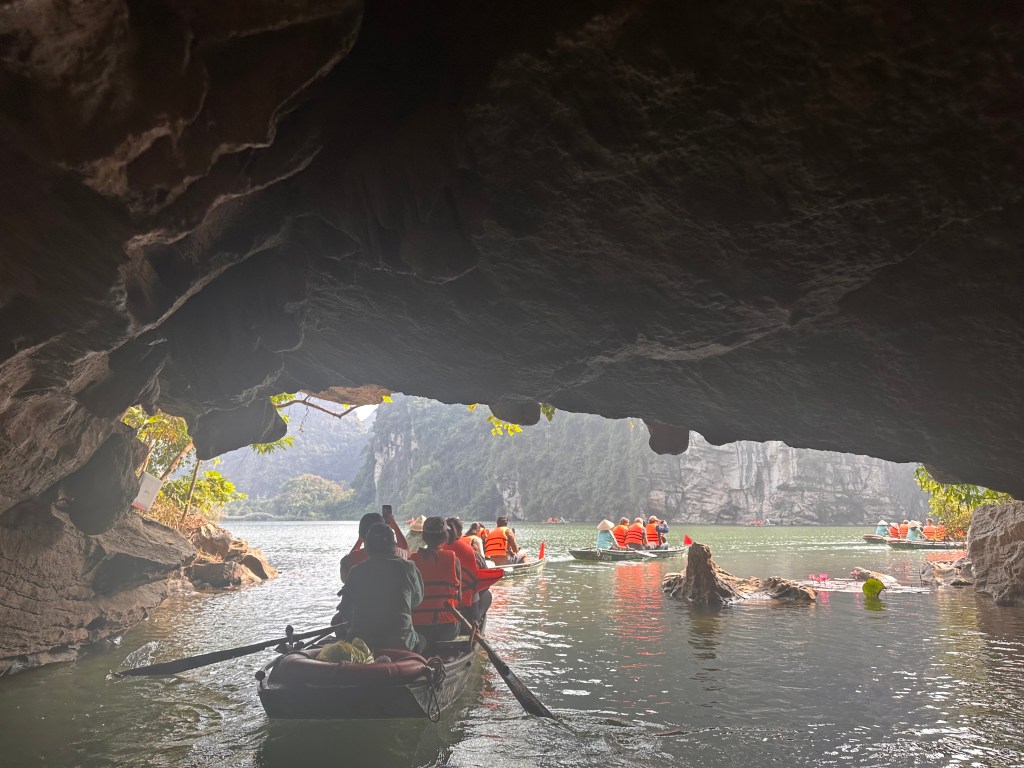
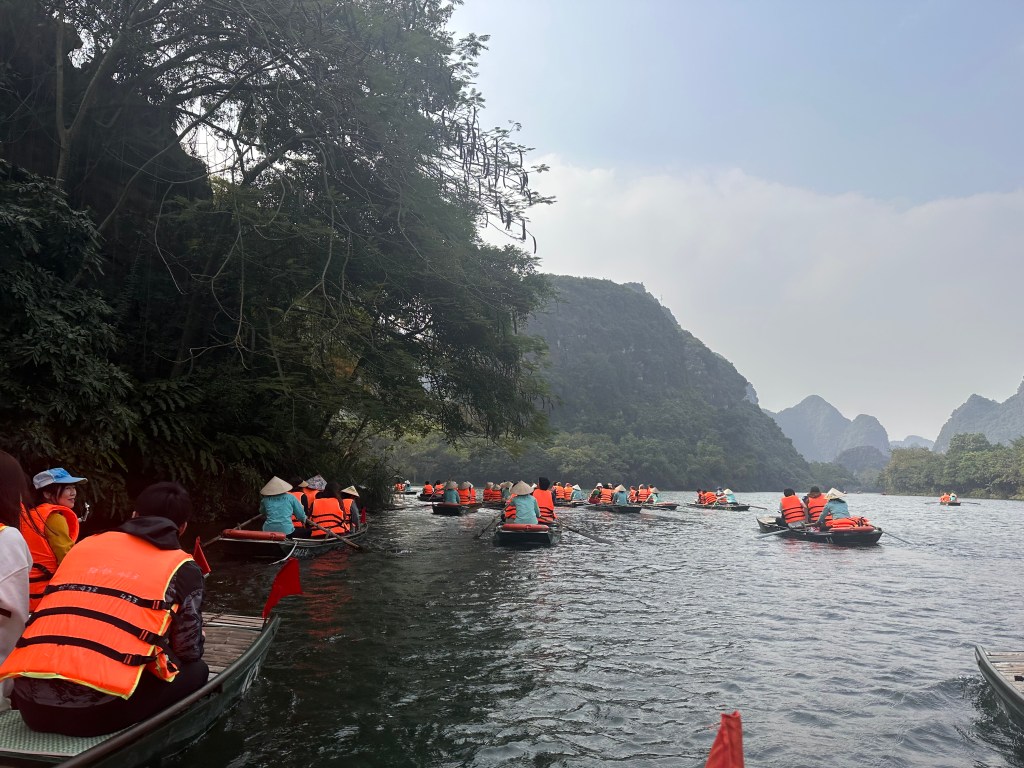
The afternoon was spent on a tranquil ride in traditional sampan boats, their unique design adding to the charm of the experience. These flat-bottomed wooden boats are rowed by local women (always talking and making jokes) and can accommodate up to four passengers. The ride felt like being part of a school of fish, effortlessly flowing together in perfect rhythm through the water. The cool weather enhanced the magic as we glided through the Trang An Caves, a mesmerizing network of interconnected caves and waterways surrounded by dramatic limestone mountains. However, caution was necessary—low cave ceilings meant you could easily bump your head if not careful!
Along the way, we stopped at ancient sites like Cao Son Temple and Suoi Tien Temple, nestled amidst lush greenery. These stops not only offered a chance to explore the spiritual history of the area but also served as a welcome restroom break during the two-hour journey.
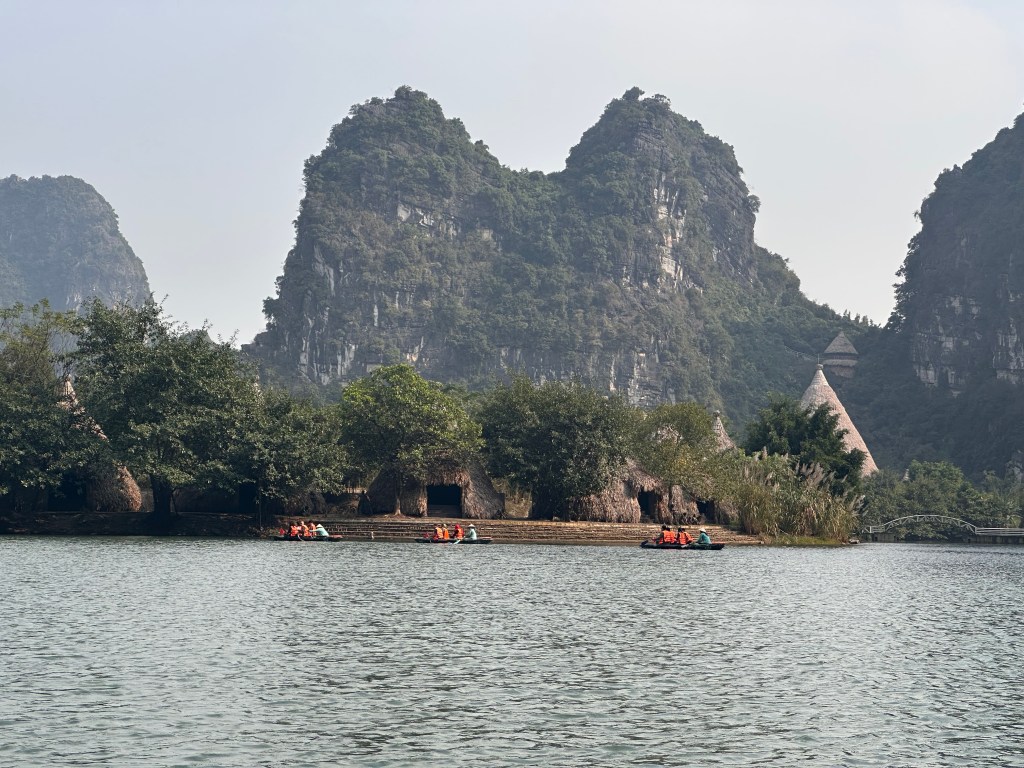
Trang An’s ethereal beauty has also earned it international recognition as a filming location for Kong: Skull Island. Its otherworldly landscapes bring to life the feeling of stepping onto a movie set, blending stunning natural scenery, rich history, and a touch of cinematic magic.
Ngoa Long (Lying Dragon) mountain


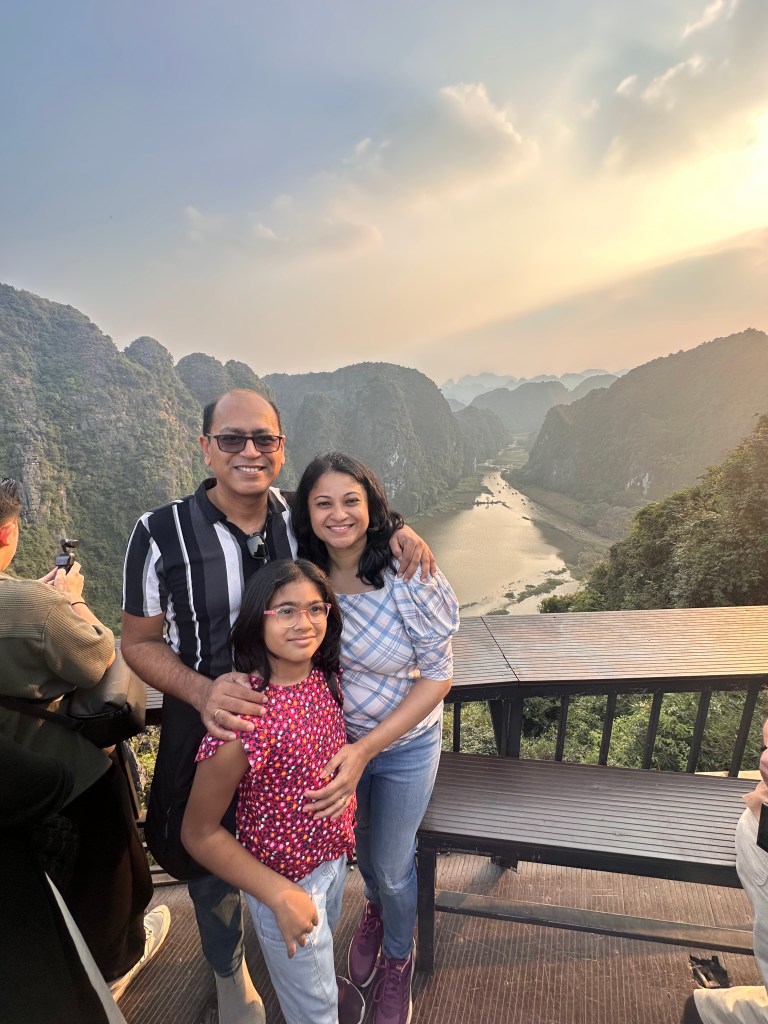
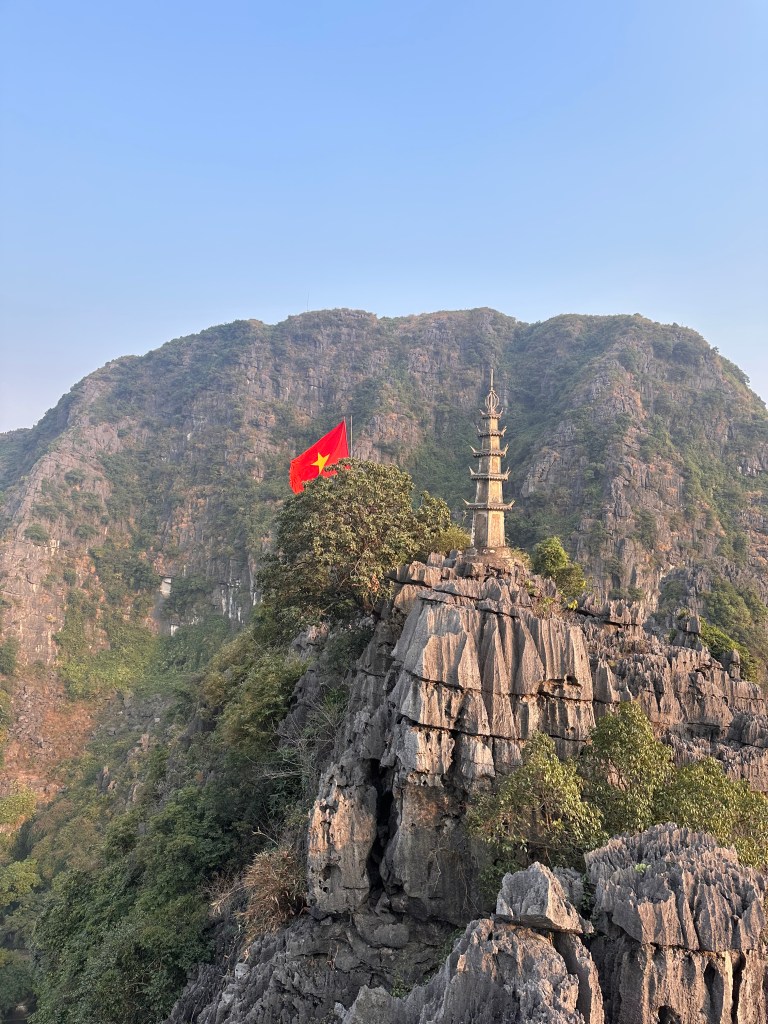
The Ngoa Long Mountain, located in the Mua Cave area, offers one of the most stunning panoramic views in Ninh Binh. A popular trekking spot, it’s often said, “A trek a day keeps stress away!” Our guide cheerfully estimated 20 minutes to climb up, 20 minutes to soak in the views, and 20 minutes to descend—but the reality is never quite so balanced. The climb is steep, with two routes: a steeper left side boasting spectacular vistas and a slightly easier right side. We opted for the more challenging left route, navigating short, steep steps that tested our endurance.
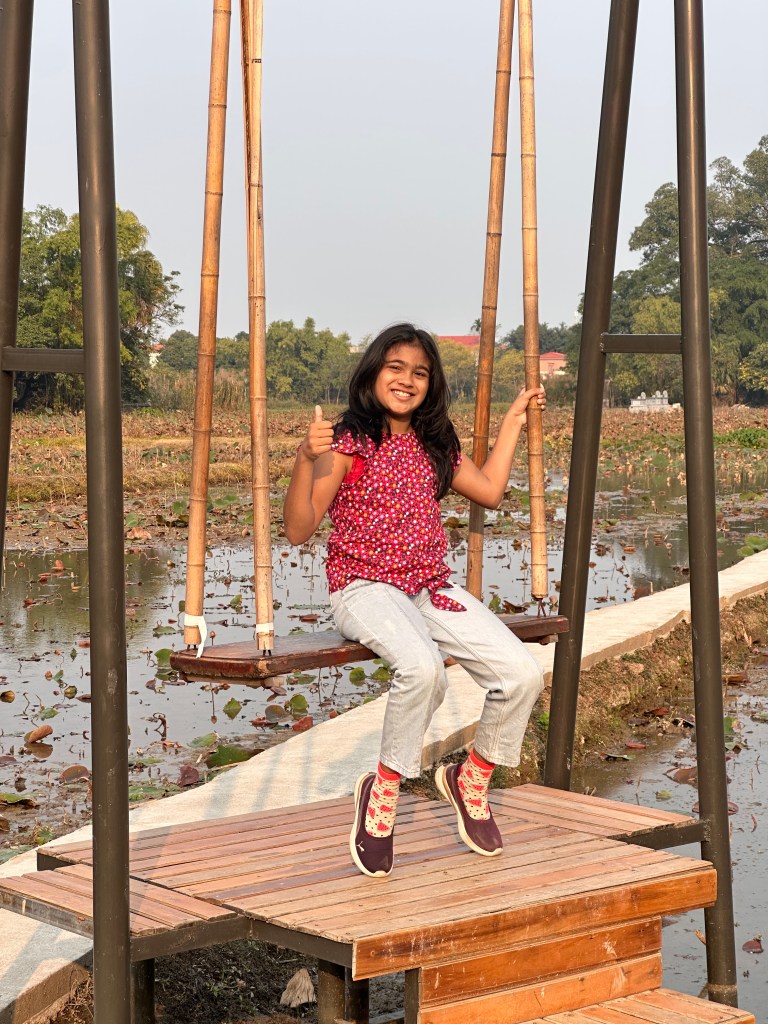
Before tackling the ascent, we took a leisurely walk around the tranquil lotus ponds, capturing some beautiful photos. The climb was rewarding, and at the summit, the breathtaking view of rice fields, limestone karsts, and the surrounding landscape made every effort worthwhile. Ngoa Long Mountain is truly a trekker’s delight and a photographer’s paradise.
Day 4: Da Nang
We had an early morning flight to Da Nang (Flight VJ 503: Hanoi [HAN] to Da Nang [DAD], departing at 7:20 AM), which meant a hectic night of packing and an early scramble to the airport. Adding to the chaos, we had squeezed in a night visit to Hanoi Train Street—an experience we didn’t want to miss.
Sleep was scarce, coming in short bursts during the car ride, at the airport, and on the flight. Still, those quick naps were enough to recharge us for the day ahead. Our walking pace had shifted to “turtle mode,” and every step was a not-so-gentle reminder that our muscles were staging a protest after the Day 3 climb!
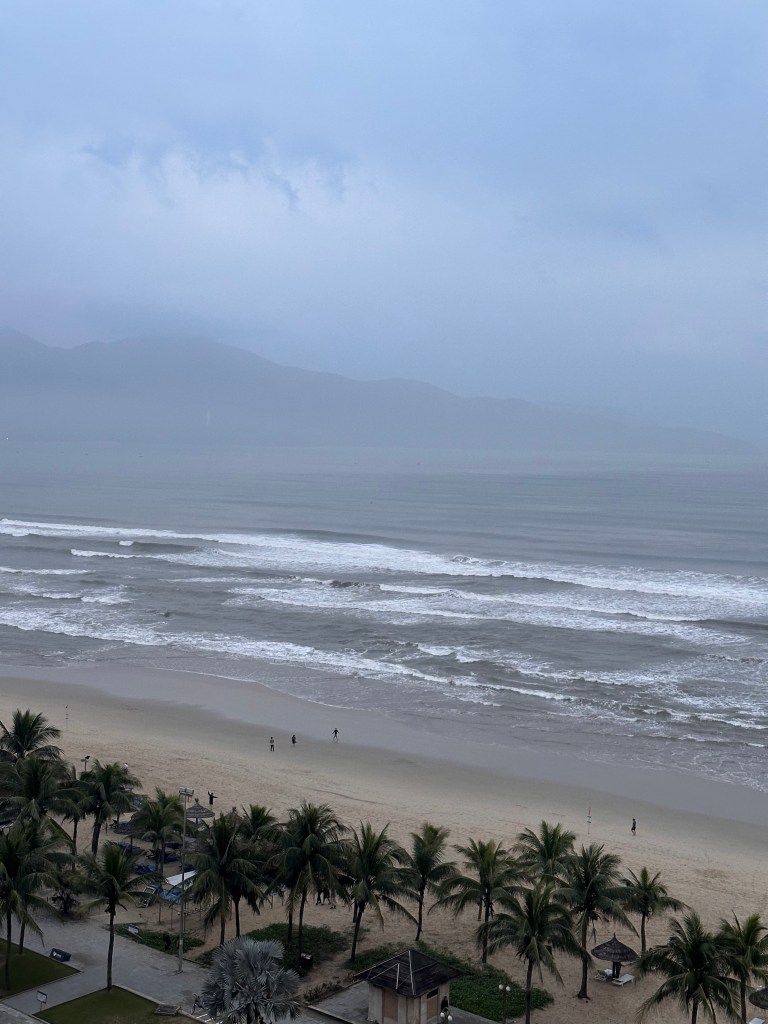
Once in Da Nang, we checked into Holiday Beach Resort, located on a beautiful stretch of My Khe beach. With no specific plans, we started the day with breakfast and a relaxing stroll along the shore. The waves were perfect for surfing, and we spent time watching skilled surfers and beginners alike tackling the high swells. We were not keen on jumping into the cold waters of the south china sea.
While soaking in the peaceful beach atmosphere, we spoke with our tour guide, who enthusiastically suggested visiting Hoi An. Her advice? “Just grab a taxi and go!” With no set plans, it felt like the perfect spontaneous next step.
Hoi An: Coconut Village


We visited the Hoi An Coconut Village and had an amazing time exploring its lush coconut groves. Riding in traditional round basket boats, expertly steered by local rowers (mostly men), we navigated through a maze of winding waterways. The guides entertained us with impressive boat tricks and even fished out crabs, adding to the excitement. The peaceful setting of the groves was beautifully complemented by the lively music and cheerful atmosphere. To make the experience even more special, we had a fun photo shoot, creating lasting memories of this vibrant slice of Vietnamese culture.
Hoi An: Old Town
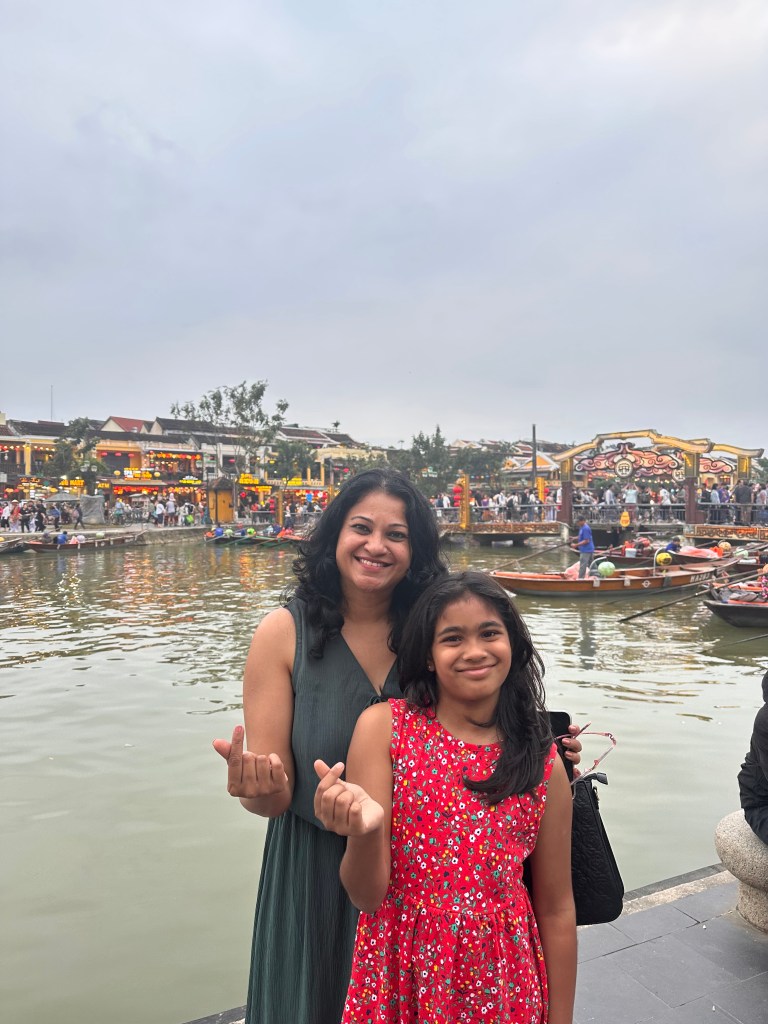
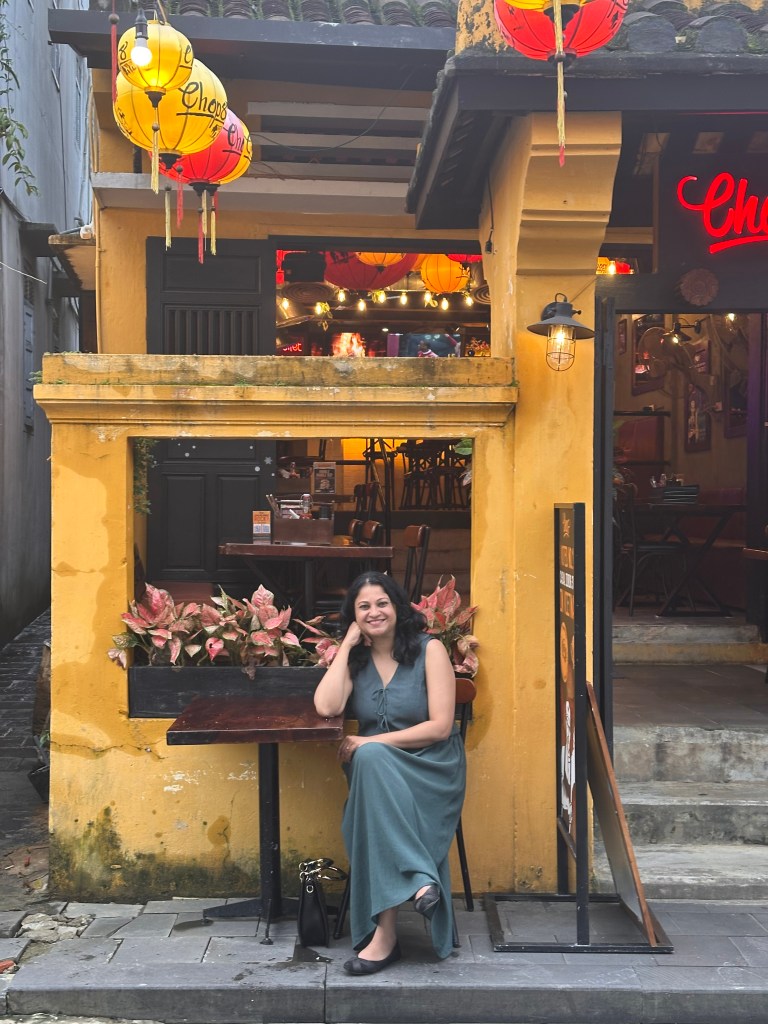


After visiting the Coconut Village, we hopped into another taxi and headed to Hoi An Old Town. The charming streets welcomed us with their iconic yellow buildings and bustling riverside vibe. Since most shops in Hoi An only accept cash, our first stop was an ATM before we began exploring.
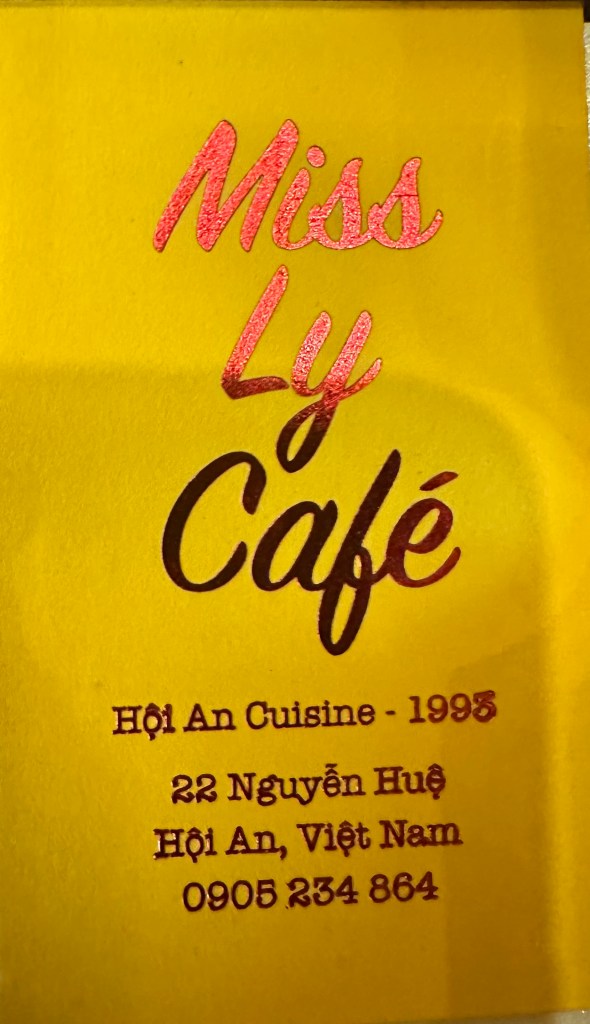
We wandered through the streets, passing boatkeepers along the river and inviting us for the 10:00 PM lantern-lighting rides. Along the way, we stopped for ice cream and enjoyed a delicious Vietnamese lunch at Miss Ly Café. The town seemed to understand Indian travelers well—the kind waitress went out of her way to offer true vegetarian dishes alongside seafood and chicken options, which we really appreciated.
Of course, we couldn’t resist picking up a few souvenirs, but the highlight for the kids (and us!) was the smoky ice cream, which felt like a show in itself. We also tried some street fruits—mango and jackfruit—despite our kids’ humorous warnings not to. To end the evening, we watched a lively dance performance by the riverside, soaking in the cultural charm of Hoi An. It was truly a day to remember!
Smoking ice cream in Hoi An comes surrounded by liquid nitrogen vapor, creating a dramatic “smoking” effect as you eat it. The cool, foggy spectacle makes it feel like more than just dessert—it’s an experience! It’s a must-try for anyone looking to add a little flair to their culinary adventures in Hoi An.
Day 5: Ba Na Hills


It was the last day of the year, and we started early, joining a group of fellow travelers. This group was primarily “Indian,” but not everyone was from India. In Da Nang, the convenience of buses picking you up directly from your hotel was a nice touch. The ride to Ba Na Hills was scenic, and soon we were on the cable car, ascending through misty clouds with breathtaking views of the Mo Stream below.
The English of our Vietnamese tour guide took some effort to understand, but with patience on both sides, we managed just fine. Like school kids, we were assigned group numbers and had to respond to roll calls, adding a touch of humor to the experience.
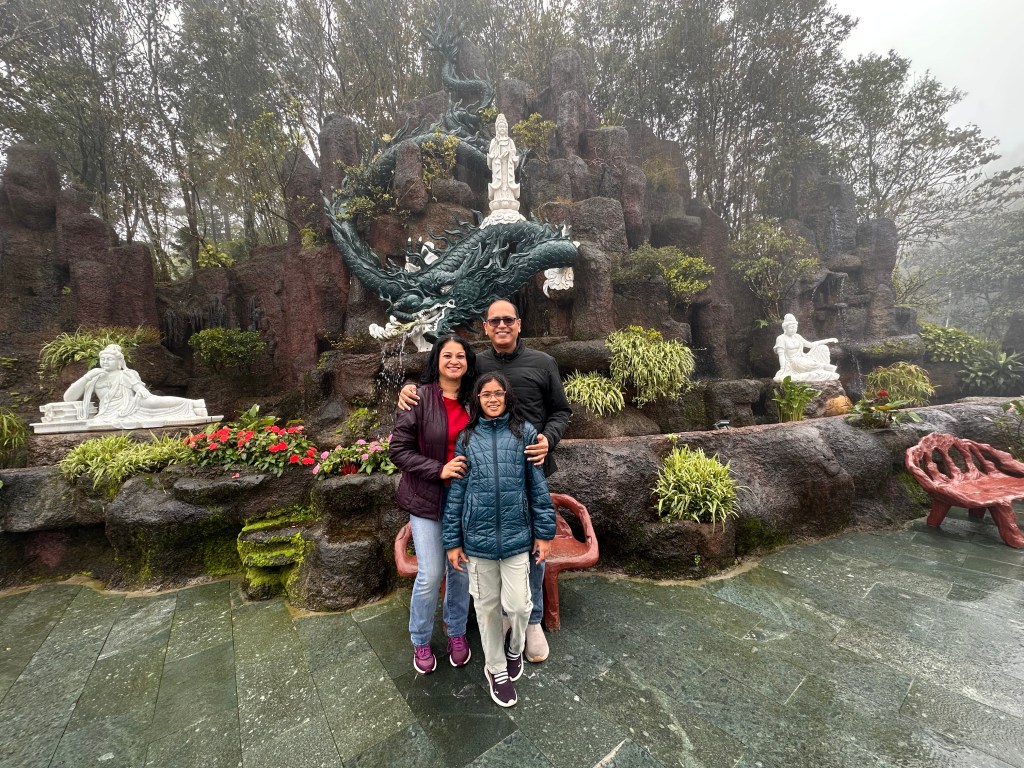
Ba Na Hills, originally developed in 1919 as a French hill station, has since transformed into a vibrant tourist destination. It felt like a mix of Disneyland and Ocean Park Hong Kong. Nestled atop the Trường Sơn Mountains, it offered a fascinating blend of natural beauty and man-made attractions. The cloudy, cold, and rainy weather added an ethereal charm, making it feel as if we were walking among the clouds. Thankfully, we had packed umbrellas to stay prepared.
Our adventure began with the iconic Golden Bridge, held aloft by the massive “Hands of God.” We arrived early enough to snap some photos before the crowds descended. Getting a clear shot, however, was nearly impossible with so many visitors vying for the same goal. Professional photographers stationed there had software to remove other people from your photos, but their services came at a steep price.
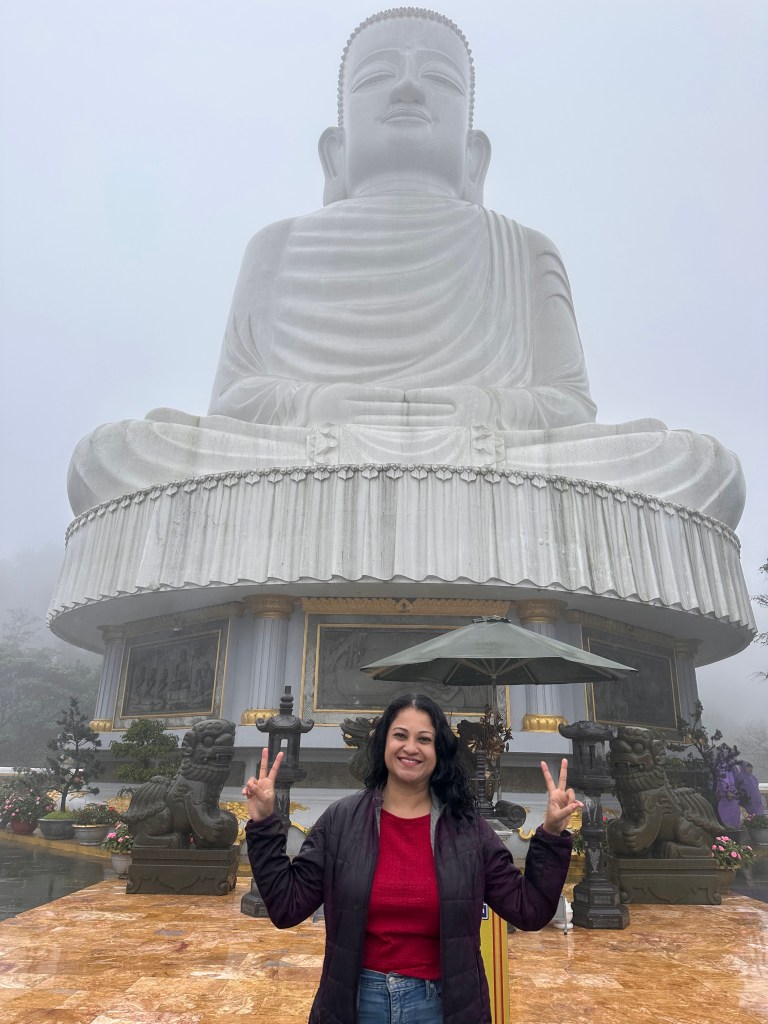
Expertly guided by our tour leader, we explored a variety of attractions, from the charming French Village to the peaceful 27-meter Buddha statue and the vibrant Flower Garden. Each stop felt like stepping into a different world, creating a truly diverse and exciting experience. We even took a tram ride to watch a 7D film, which transported us to fascinating places around the globe with its immersive visuals.
By lunchtime, my daughter was craving the comfort of a simple Indian meal. To help us beat the cold, we were treated to complimentary beers (truly elixirs from heaven). Our guide directed us to an Indian restaurant offering a buffet, which included plain dal and rice—just what my daughter wanted—alongside some pasta for variety.
After lunch, although we had some time left to explore Fantasy Park, the biting cold and windy weather (despite a forecast of 12°C, it felt much colder due to the rain and wind) forced us to seek warmth. We found ourselves, like many other families, huddled around a heater to warm our hands.
Ultimately, we decided to skip both the Fantasy Park and Linh Chua Linh Tu Temple. Instead, we opted to descend via the cable car and returned to the hotel by 5:30 PM, choosing comfort over braving the harsh weather in Ba Na Hills.
Happy New Year, 2025!


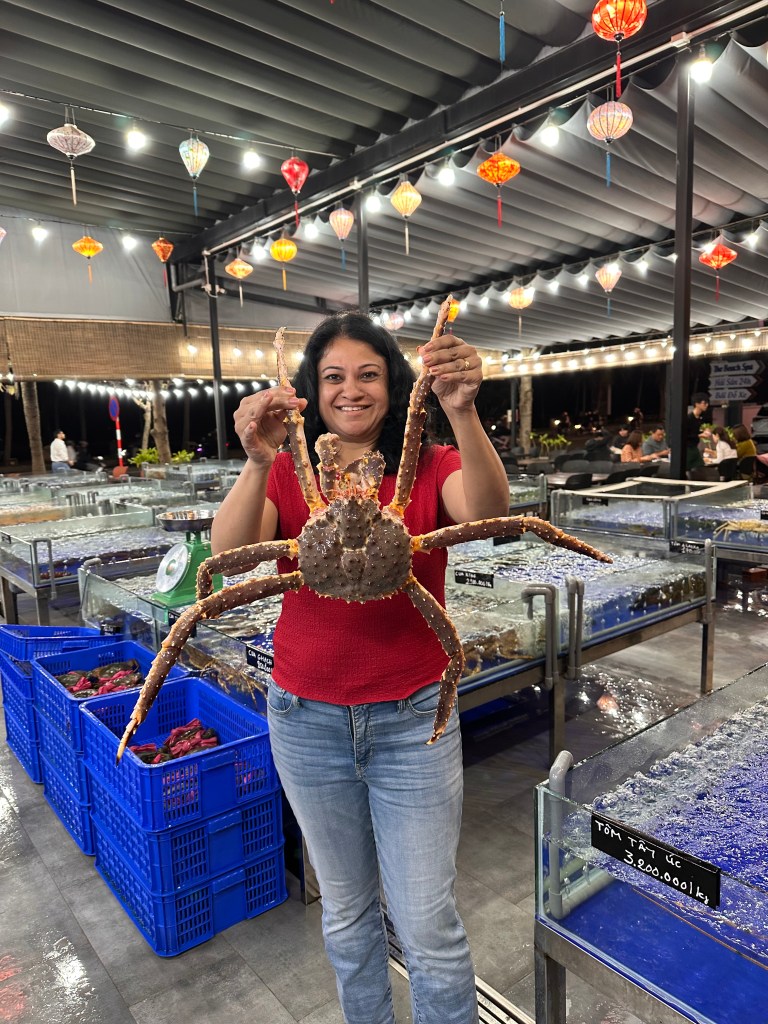


As the evening approached, we hoped the rain wouldn’t dampen our New Year’s plans—and luckily, it didn’t! We strolled around Da Nang, indulging in more Indian food for my daughter, sipping on unique Vietnamese coffees, getting a foot massage, and savoring fresh seafood, including a large crab. It was a perfect way to close out the year, blending familiar comforts with local flavors and experiences.
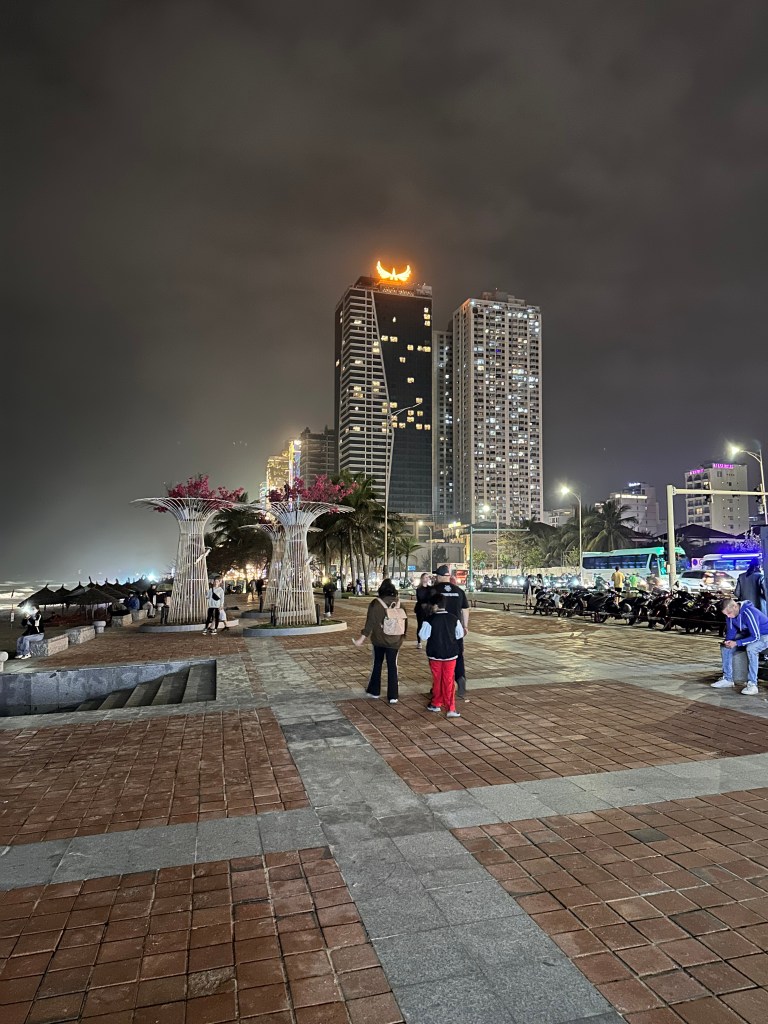
The streets were buzzing with life, packed with cafés serving every cuisine you can imagine, massage spas ranging from cozy to extravagant, and shopping marts eager to satisfy every whim of the visiting crowds. Every other corner seemed to have an Indian restaurant blaring ’90s Bollywood hits, adding a nostalgic desi touch to the lively atmosphere.
Big names like Sheraton and Marriott are racing to stake their claim along the beach, hinting at an even glitzier future for Da Nang. Meanwhile, the present was alive with loud party music echoing from various hotspots, each vying to pull in crowds for the midnight countdown.
Unfortunately, the famous 45-minute Da Nang fireworks show was canceled this year for environmental reasons, leaving some disappointed. But not all was lost—many families opted for a quieter celebration, strolling along the beach where small shops lit up the night with minor fireworks to keep the festive spirit alive. It was a vibrant mix of noise, nostalgia, and seaside serenity—a fitting end to the year!
We strolled back to our room, quietly responded to several New Year messages, and enjoyed a much-needed nap to prepare for another long (but last) day of travel.
Day 6: Hue
We reluctantly dragged ourselves out of bed for an early drive to Hue City. Hue is pronounced “h-way,” with an emphasis on the “h” sound at the start, followed by a drawn-out “u,” similar to saying “way.”
Once again, we were picked up and found ourselves among a group of sleepy international travelers, exchanging cheerful New Year wishes with everyone. Hue is renowned for its rich history and cultural significance, making it a must-visit destination.
The journey itself was an experience, taking us through the Hai Van Tunnel, the longest and most modern tunnel in Southeast Asia. This marvel of engineering not only made the drive smoother but also added a touch of awe to the trip.
Hue’s dialect is often considered more elegant and poetic compared to other regions in Vietnam. It’s said that the people of Hue speak with a soft, lilting tone that reflects the city’s historical ties to Vietnam’s royal past.
Lap An Lagoon

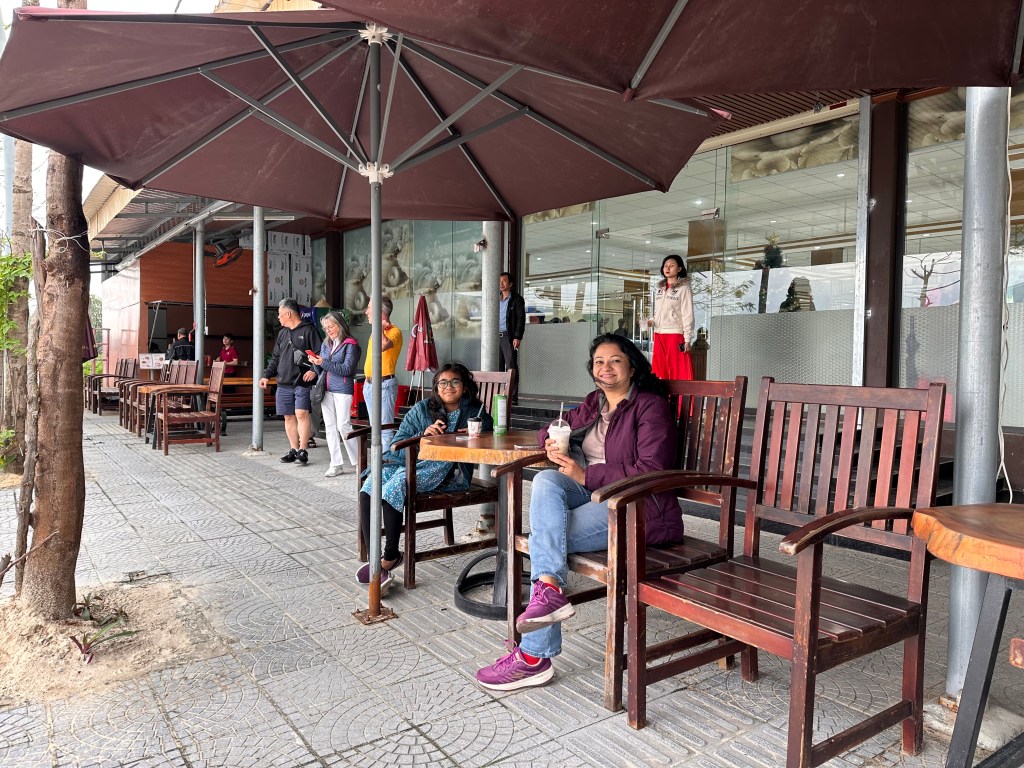
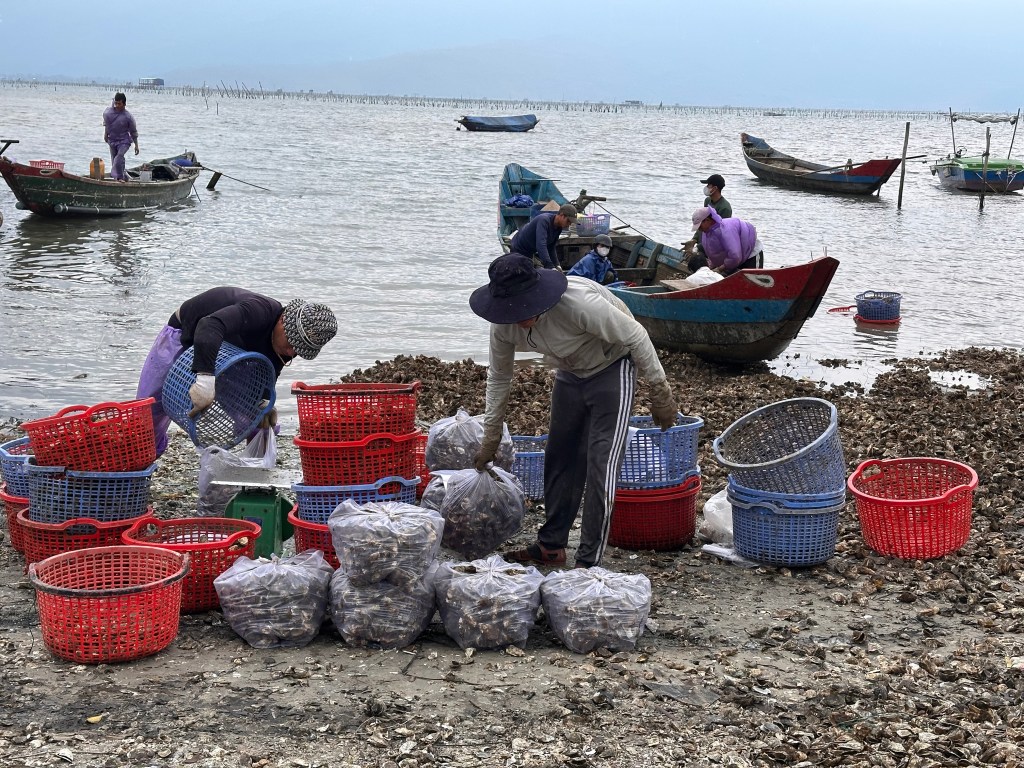
We made our first stop at Lap An Lagoon, located west of Lang Co Bay. This picturesque lagoon is surrounded by mountains and is home to several pearl farms. We spent some time taking in the serene views, sipping salt coffee, and watching local pearl farmers separating pearl oysters before continuing our journey.
Khai Dinh Tomb


Upon arriving in Hue, our first visit was to the Khai Dinh Tomb, one of the most beautiful and intricate royal tombs of the Nguyen Dynasty. The stunning architecture combines traditional Vietnamese and European elements, making it a truly unique historical site. The detailed carvings and mosaics were a testament to the grandeur of the Nguyen kings.
Many of the intricate carvings and mosaics in Khai Dinh Tomb were reportedly created by artists using their feet—a technique viewed as a bad omen in Vietnamese culture. There are two fascinating stories behind this unusual technique. One suggests that the artists used their feet as an act of protest against Emperor Khai Dinh, who raised taxes to fund the construction of the tomb. Another version claims the method was purely practical—ceiling paintings and carvings were done using feet so the artists could lie back and see the artwork as they worked, ensuring better precision and perspective.
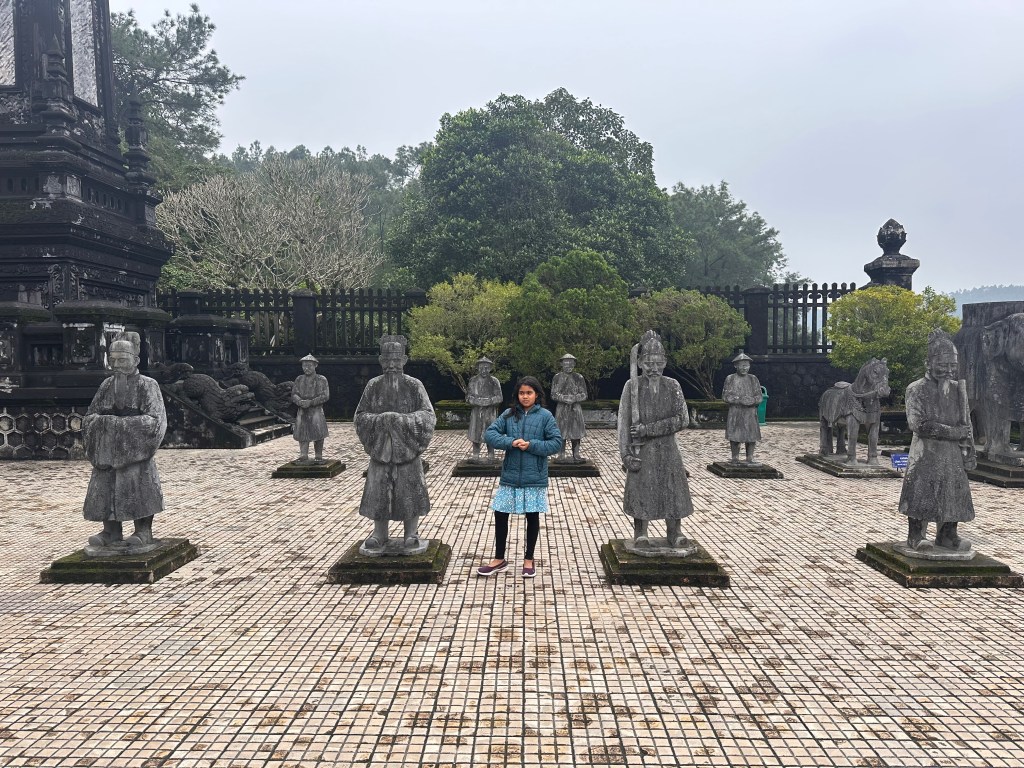
Towering at the top of 127 steps, the tomb exudes grandeur. The structure is covered in blackened concrete, which gives it an imposing presence against the lush green backdrop of the mountains. The interior, however, bursts into vibrant life with colorful glass and porcelain mosaics adorning the walls. The most striking feature is the statue of Emperor Khai Dinh, cast in bronze and seated beneath a celestial ceiling painting that depicts a lively dragon amidst clouds.
Thien Mu Pagoda


Post-lunch (at a local restaurant), we visited the Thien Mu Pagoda, Hue’s oldest and most beautiful pagoda. This iconic site, perched on a hill overlooking the Perfume River, is a symbol of Hue’s spiritual heritage but also a serene retreat that offered a peaceful pause in our journey.
The name “Thien” means “heavenly” or “celestial,” while “Mu” translates to “lady,” together symbolizing a divine feminine spirit. According to legend, an old woman appeared on the hill where the pagoda now stands, prophesying that a great leader would build a temple here to bring peace and prosperity to the region. Inspired by this, Lord Nguyen Hoang ordered the construction of the pagoda in 1601, marking the beginning of its storied history.
The pagoda is also tied to a tragic love story in local folklore. Legend has it that couples who visit the pagoda together—especially those holding hands—might face separation afterward. While this remains a superstition, it adds an intriguing and mystical element to the otherwise serene and spiritual site. As our tour guide jokingly remarked, “If you’re looking for separation, just hold hands here!”
The Phuoc Duyen Tower, a seven-story pagoda, stands as an iconic symbol of Hue here. Each of its seven stories represents a step on the Buddha’s path to spiritual awakening. This concept is tied to the legend of Buddha’s seven steps at birth, where each step was marked by a blooming lotus flower, symbolizing purity and enlightenment.
There were many bonsai trees in the gardens here. Miniature trees, commonly known as bonsai, are referred to as cây cảnh or “ornamental trees” in Vietnamese culture. These living art forms are meticulously shaped to balance natural beauty and artistic vision, showcasing the grower’s skill and patience. Bonsai symbolizes harmony, balance, and interconnectedness, often representing nature’s grandeur in a small form. For many, caring for bonsai is a meditative practice fostering mindfulness and inner peace. In Vietnamese and East Asian traditions, they are associated with Feng Shui, believed to attract positive energy, prosperity, and good fortune. Historically, bonsai also signified wealth and status, often adorning the homes of nobles and scholars. Whether for artistic, spiritual, or cultural reasons, bonsai remains cherished worldwide.
Hue Citadel


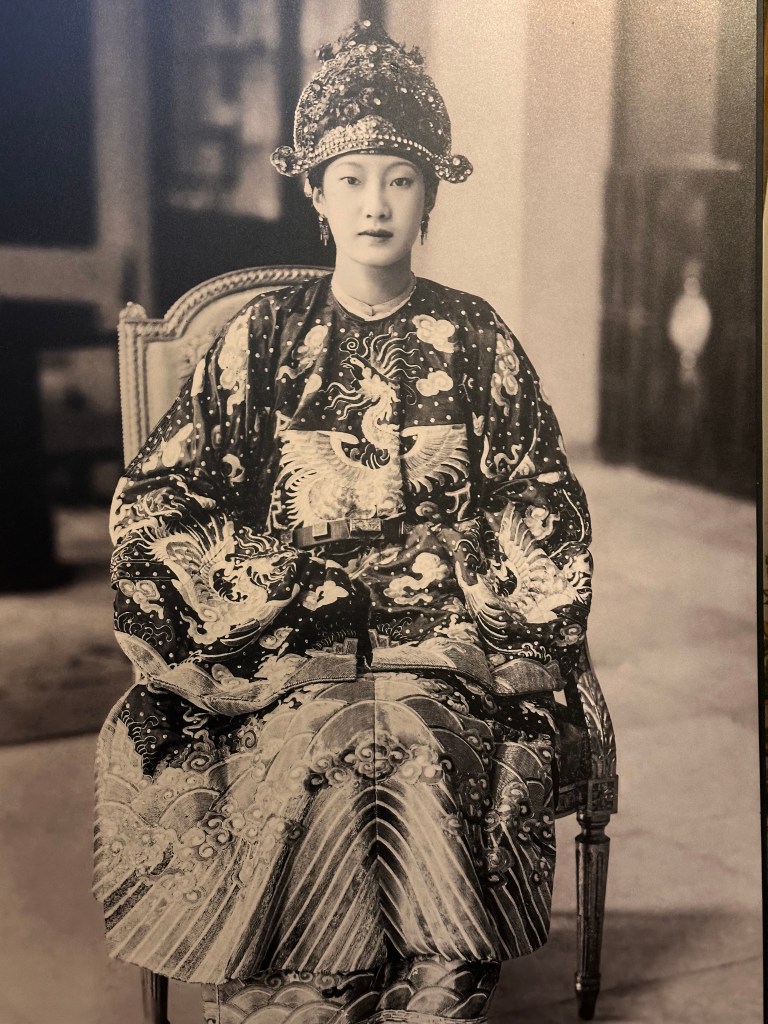
Our last destination was the Hue Citadel, a UNESCO World Cultural Heritage site since 1993. This massive complex, with its walls, palaces, and gates, holds the legacy of the 13 Nguyen dynasty kings who ruled for over 140 years. Despite enduring the ravages of time and war, the Citadel continues to preserve its historical significance and charm.
Approximately 40% of Vietnamese people have the surname Nguyen, making it by far the most common surname in Vietnam. The prevalence of this surname is linked to the Nguyen Dynasty, the last imperial dynasty of Vietnam, which ruled from 1802 to 1945. During this time, many people adopted the surname as a sign of loyalty or to align themselves with the ruling class.
The undisputed highlight of the day? Our royal visit to the royal toilet! Who knew history could be so flush with grandeur?
After a two-hour walk exploring Hue’s rich history and culture, exhaustion caught up with us, and we quickly fell asleep on the bus ride back to Da Nang. The driver smoothly navigated the route, and we arrived at our hotel by 6:30 PM, marking the official end of our holiday adventures.
Last Evening
To celebrate our final evening in Vietnam, we indulged in a feast of fresh seafood by the beach, including a mouthwatering lobster, and savored one last round of aromatic Vietnamese coffee—a fitting farewell to the culinary delights of this vibrant country.
Special Mention: Vietnamese Coffee
Vietnamese coffee culture is incredibly diverse, with a wide variety of options to explore. Popular choices include Cà Phê Sữa Đá (iced coffee with milk), Cà Phê Đen (black coffee), Cà Phê Trứng (egg coffee), Cà Phê Dừa (coconut coffee), Bạc Xỉu, and the luxurious Cà Phê Chồn (weasel coffee). Another unique offering is Avocado Coffee, a creative blend of flavors. Each type reflects the rich coffee heritage of Vietnam and offers something for every palate. You can have coffee hot or iced!
Done Done
If you’ve reached here, congratulations! This travelogue was penned down immediately after our trip, before the busy workdays started rolling in and the memories began to blur.
One thing that still makes us laugh is how I kept calling “Da Nang” “Ha Dang”, completely forgetting the real name. The names of the places we visited—Ha Noi, Hoi An, Ninh Binh, Ha Long, Da Nang, Ba Na, Hue, Sung Sot, Bo Hon, Luon, Trang An, Cao Son, Suoi Tien, Ngoa Long, Thien Mu, and Lap An—felt like tongue twisters at times. I couldn’t help but mix up Da Nang with Ha Dang, much to everyone’s amusement! My daughter made sure I was properly “punished” for my slip-up with endless giggles. We googled Ha Dang, and found that to be a real person’s name!
I suggest you put Vietnam on your bucket list! Cheers