Data Semantics

The real world is uncertain, inconsistent, and incomplete. When people interact with the real world, data from their inbuilt physical sensors (eyes, ears, nose, tongue, skin) and mental sensors (happiness, guilt, fear, anger, curiosity, ignorance, and many more) get magically converted into insights and actions. Even if these insights are shared & common, the actions may vary across people.

Example: When a child begs for money on the streets, some people choose to give money, others prefer to ignore the child, and some others decide to scold the child. These people have a personal biased context overlooking the fact that it’s a child begging for money (or food), and their actions result from this context.

The people who give money claim that they feel sorry for the child, and parting away little money won’t damage them and help the child eat. The people who don’t give money argue that giving cash would encourage more begging, and a mafia runs it. Some people may genuinely have no money, and others expect the governments (or NGOs) to step up.

Switching context to the technology world:

With IoT, Cloud, and BIG Data technologies, everybody wants to collect data, get insights, and convert these insights into actions for business profitability. This computerized data and workflow automation system approximates an uncertain, inconsistent, and incomplete real-world setup. Call this IoT, Asset Performance Management (APM), or a Digital Twin; the data to insights to actions process is biased. Automating a biased process is a hard problem to solve.

It’s biased because of semantics of the facts involved in the process.

semantics [ si-man-tiks ]

“The meaning, or interpretation of the meaning, of a fact or concept”

Semantics is to humans as syntactic is to machines. So, a human in the loop is critical to manage semantics. AI is changing the human-in-the-loop landscape but comes with learning bias.

Let’s try some syntactic sugar to decipher semantics.

Data Semantics, Data Application Semantics

Data semantics is all about the meaning, use, and context of Data.

Data Application Semantics is all about the meaning, use, and context of Data and application agreements (contracts, methods).

Sounds simple? Not to me. I had to read that several times!

Let’s dive in with some examples:

Example A: A Data engineer claims: “My Data is structured (quantifiable with schema). So, AI/BI applications can use my Data to generate insights & actions”. Not always true. Mostly not.

Imagine a data structure that captures the medical “heart rate” observation. The structure may look like {“rate”: 180, “units”: ‘bpm’} with a schema that defines the relevant constraints (i.e., the rate is a mandatory field and must be a number >=0 expressed as beats per minute).

An arrhythmia detection algorithm, analyzing this data structure might send out an urgent alarm – “HELP! Tachycardia”, and dial 102 to call an ambulance. The ambulance arrives to find that the person was running on a treadmill, causing a high heart rate. This Data is structured but “incomplete” for analysis. The arrhythmia detection algorithm will need more context than the rate and units to raise the alarm. It will need context to “qualify” and “interpret” the “heart-rate” values. Some contextual data elements could be:

  1. Person Activity: {sleeping, active, very active}
  2. Person Type: {fetal, adult}
  3. Persons age: 0-100
  4. Measurement location: {wrist, neck, brachial, groin, behind-knee, foot, abdomen}
  5. Measurement type: {ECG, Oscillometry, Phonocardiograpy, Photoplethysmography}
  6. Medications-in-use: {Atropine, OTC decongestants, Azithromycin, …}
  7. Location: {ICU, HDU, ER, Home, Ambulance, Other}

Let’s look at this example from the “semantics” definition above:

  1. The meaning of “heart rate” is abstract but consistently understood as heart contractions per minute.
  2. The “heart rate” observation is used to build an arrhythmia detection application.
  3. Additional data context required to interpret “heart-rate” is Activity, Person Type, Person Age, Measurement Location, Measurement Type, Medications-in-use, and Location. This qualifying context is use-specific. An application to identify the average heart-rate range in a population by age intervals needs only the Person Age.
  4. The algorithm’s agreement (contract = what?) is to “Detect arrhythmias and Call Ambulance in case of ER care”
  5. The algorithm’s agreement (method = how?) is not well defined. A competing algorithm may use AI to make a better prediction to avoid false alarms. This is similar to our beggar child analogy, where the method of the people to derive insight differed, resulting in different actions.

Example B: Another familiar analogy to help understand “meaning,” “use,” “context,” and “agreement” is to look at food cooking recipes. Almost all these recipes have the statement “add salt to taste.”

  • The meaning of “Salt” is abstract but consistent. Salt is not sugar! 🙂 It’s salt.
  • Salt is used to make the food tasty.
  • Additional data context required to interpret “Salt” is the salt-type {pink salt, black salt, rock salt, sea salt}, users salt toleration level {bland, medium, saltier}, users BP, and users-continent {Americas, Asia, Europe, Africa, Australia}.
  • The agreement (contract = what?) is to “Add Salt.”
  • The agreement (method = how?) is not well defined. Depending upon the chef, she may have a salt type preference with variations to the average salt toleration levels. For good business reasons, she may add less salt than her salt toleration level and serve extra salt to allow the customer to adjust the food taste according to the customer’s salt toleration levels.

In computerized systems, physical-digital data modeling can achieve data semantics (meaning, use, context). It’s much harder to achieve data application semantics (data semantics + agreements). Data Interpretation is subject to the method, and associated bias.

So, to interpret data, there must be a human in the loop. Not all people infer equally. Thus, semantics leads to variation in insights. Variation in insights leads to variation in actions.

Diving into Context – It’s more than Qualifiers

Alright, I want further peel the “context” onion. Earlier, we said that “context” is used to “qualify” the data. There is another type of context that “modifies” the data.

Let’s go back to our arrhythmia detection algorithm (Example A). We have not captured and sent any information about the patient’s diagnosis to the algorithm. The algorithm does not know whether the high heart rate is due to Supra-ventricular Tachycardia (electric circuit anomaly in the heart), Ventricular Tachycardia (damaged heart muscle and scar tissue), or food allergies. SVT might not require an ER visit, while VT and food allergies require an ER visit. Let’s say our data engineers capture this qualifying information as additional context:

{prior-diagnosis: [], known-allergies:[]}

Great. We have qualifying context. So, what does diagnosis = [] mean? The patient does not have SVT and VT? No, Not true. It means that the doctors have not tested the patient for the condition or not documented a negative result of the test in the data system. It doesn’t mean that the patient has neither SVT nor VT. So, we are back to square one. Now, let’s say that we have a documented prior diagnosis:

{prior-diagnosis: [VT], known-allergies: []}

Ok, even with this Data, we cannot confirm that VT causes a high heart rate. It could be due to undocumented/untested food allergies or yet undiagnosed SVT. This scenario calls for data “modifiers.”

{prior-diagnosis-confirmed: [VT], prior-diagnosis-excluded: [SVT], known-allergies-confirmed: [pollen, dust], known-allergies-excluded: [food-peanuts]}

The structure above has more “semantic” sugar. There is a diagnosis-excluded: [SVT] modifier as a “NOT” modifier on “diagnosis.” This modifier helps to safely ignore SVT as a cause.

Summary

Going from data to insights to actions is challenging due to “data semantics” and “data application semantics.”

Modeling all relationships between real-world objects and capturing context mitigates “data semantics” issues. Context is always use-specific. The context may still have “gaps,” and inferencing data with context gaps lead to poor-quality insights.

“Data application semantics” is a more challenging problem to solve.

The context must “qualify” the data and “modify” the qualifiers to improve data semantics. This context “completeness” requires collecting good quality data at source. More than often, an human data analyst goes back to the data source for more context.

When technology visionaries say “We bring the physical and digital together” in the IT industry, they are trying to solve the data semantics problem.

For those in healthcare, the words “meaning” and “use” will trigger the US government’s initiative of “meaningful use” and shift to a merit-based incentive payment system. To achieve merit-based incentives, the government must ensure that the data captured has meaning, use, and context. The method (= how) used by the care provider to achieve the outcome is important but secondary. This initiative also serves as a recognition that data application semantics are HARD.

Enough said! Rest.

Data Measurement Scale and Composition

In the parent blog post, we talked about data terms: “Structured, Unstructured, Semi-structured, Sequences, Time-series, Panel, Image, Text, Audio, Discreet, Categorical, Numerical, Nominal, Ordinal, Continuous and Interval”; let’s peel this onion.

Some comments that I hear from engineers/architects:

“My Data is structured. So, it’s computable.”Not true. Structure does not mean that Data is computable. In general, computable applies to functions, and when used in the context of data, it means quantifiable (measurable). Structured data may contain non-quantifiable data types like text strings.

“All my Data is stored in a database. It’s structured data because I can run SQL queries on this data”Not always true. Databases can store BLOB-type columns containing structured, semi-structured, and unstructured data that SQL cannot always query.

“Data lakes store unstructured data, and this data is transformed into structured data in data warehouses”Not Really. Data lakes can contain structured data. Data pipelines extract, transform, and load data into data warehouses. The data warehouse is optimized for multi-dimensional data queries and analysis. Inability to execute queries in data lakes does not imply that Data in the lake does not have structure.

Ok, it’s not as simple as it appears on the surface. Before we define the terms, let’s look at some examples.

Example A: The data below can be classified as structured because it has a schema. The weight sub-structure is quantifiable. “Weight-value” is numeric and continuous type data type, and “weight-units” is categorical and nominal data type.

nameweight-valueweight-units
Nitin79.85KG
Example A: Panel Data
FieldMandatoryData TypeConstraints
nameYesStringNot Null
Length < 100chars
weight-valueYesFloat> 0
weight-unitsYesEnum{KG, LBS}
Example A: Schema & Constraints

Example B: The data below can be classified as semi-structured because it has a structure but no schema or constraints. Some schema elements can be derived, but the consumer is at the mercy of the producer. The value of weight can be found in “weight-value”, “weight”, or “weight-val” fields. Given the sample, the consumer can infer that the value is always numerical and continuous data type (i.e., float). The vendor of the weighing machine may decide to have their name captured optionally. The consumer will also have to transform “Kgs,” “KG,” and “Kilograms” into a common value before analyzing the data.

Data Instance AData Instance BData Instance C
{
“name”: “Nitin”,
“weight-units”: “Kgs”,
“weight-value”: 79.85,
“vendor”: “Apollo”
}
{
“name”: “Nitin”,
“weight-units”: “KG”,
“weight”: 79.85,
“vendor-name”: “Fitbit”
}
{
“name”: “Nitin”,
“weight-units”: “Kilograms”,
“weight-val”: 79.85,
“measured-at”: “14/08/2021”
}
Example B: JSON Data

Example C: A JPEG file stored on a disk can be classified as structured data. Though the file is stored as binary, there is a well-defined structure (see table below). This Data is “structured,” but the image data (SOS-EOI) is not “quantifiable” and loosely termed as “unstructured.” With the advance of AI/ML, several quantifiable features can be extracted from image data, further pushing this popular unstructured data into the semi-structured data space.

JFIF file structure
SegmentCodeDescription
SOIFF D8Start of Image
JFIF-APP0FF E0 s1 s2 4A 46 49 46 00 ...see below
JFXX-APP0FF E0 s1 s2 4A 46 58 58 00 ...optional,
… additional marker segments
SOSFF DAStart of Scan
compressed image data
EOIFF D9End of Image
Example C: JPEG Structure (courtesy: Wikipedia)

Example D: The Text below can be classified as “Unstructured Sequence” data. The English language does define a schema (constraint grammar); however, quantifying this type of data for computing is not easy. Machine learning models can extract quantifiable features from text data. In modern SQL, machine learning is integrated into queries to extract information from “unstructured” data.

I must not fear. Fear is the mind-killer. Fear is the little death that brings total obliteration. I will face my fear. I will permit it to pass over me and through me. And when it has gone past, I will turn the inner eye to see its path. Where the fear has gone, there will be nothing. Only I will remain.

So, the lines are not straight 🙂 Given this dilemma, let’s further define these terms, with more examples:

Quantifiable Data is measurable Data. Computing is easy on measurable data. There are two different types of measurable data – Numerical and Categorical. Numerical Data types are quantitative, and categorical Data types are qualitative.

Numerical data types could be either discreet or continuous. “People-count” cannot be 35.3, so this Data type is discreet. “Weight-value” is always approximated to 79.85 (instead of 79.85125431333211), and hence this Data type is continuous.

Categorical data type could be either ordinal or nominal. In “Star-rating,” a value of 4 is higher than 3. Hence, the “star rating” data is ordinal as there is an established order in ratings. The quantitative difference between ratings is not necessarily equal. There is no order in “cat,” “dog,” and “fish”; hence, “Home Animals” is nominal data type.

Parent CategoryChild CategoryExample
NumericalDiscreet{ “people-count”: 35 }
NumericalContinuous{ “weight-value”: 79.85 }
CategoricalOrdinal5 STAR RATING = {1,2,3,4,5}
{“star-rating”: “3”}
CategoricalNominalHome Animals = {“cat”, “dog”, “fish”}
{“animal-type”: “cat”}
Quantifiable Data (Quantitative and Qualitative)

Non-Quantifiable Data is Data where the measurable features are implicit. The Data is rich in features, but the features need to be extracted for analysis. AI is changing the game of feature extraction and pattern-recognition for such data. The three well-known examples in this category are Images, Text, and Audio. The latter two (Text and audio) are domains of natural language processing (NLP), while Images are the domain of computer vision (CV).

Quantifiable and Non-Quantifiable data can be composed together into structures. The composition may be given a name. Example: A “person” is a composite data type of quantifiable (i.e., weight) and non-quantifiable (i.e., name) data types.

When data is composed with a schema, it is loosely called “structured” data. Any composition without a schema is loosely called “semi-structured” data.

Structured or Semi-structured data with non-quantifiable fields is called unstructured data. In this spirit, example C is unstructured. Also, the quote about data lakes storing “unstructured” Data is true. The data might have a structure with schema but cannot be queried in place without loading into a data cube in the warehouse. The lines blur when modern lake-houses that query data in-place at scale.

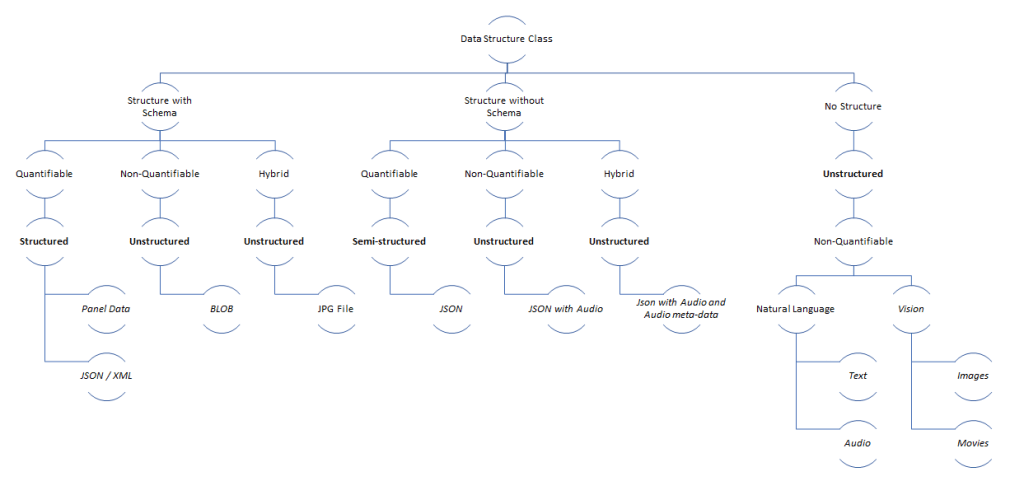
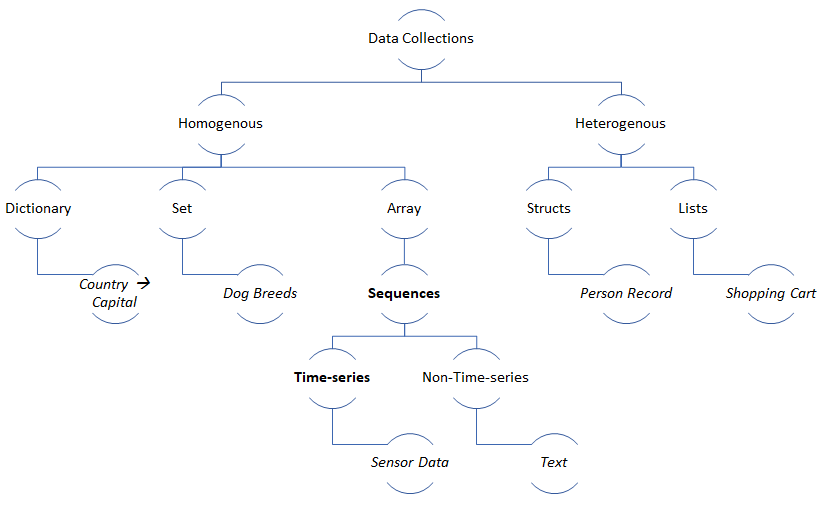
Data can also be composed together into “Collection” data types. Sets, Maps, Lists, and Arrays are examples of some collections. “Collections” with item order and homogeneity are called sequences. Movies and Text are sequences (arrays of images and words). In most cases, all data generated in a sequence is usually from the same source.

Sequences ordered by time are called time-series sequences, or just time-series for short. Sensor data that is generated periodically with a timestamp is an example of time-series data. Time-series data have properties like trend and seasonality that we will explore in a separate blog post. A camera (sensor) generates a time-series image data feed with a timestamp on every image. This feed is a time-series sequence.

Some visuals will help to clarify this further:

Data by Measurement Class
Data by Structure (composition) Class

JSON and XML are data representations that come with or without schema. It’s incorrect to call all JSON documents semi-structured, as they might originate from a producer that uses well-defined schema and data typing rules.

Data Compositions

Hope this post helps to understand the “data measurement and composition vocabulary“. You can be strict or loose about classifying data by structure based on context—however, it’s critical to understand the measurement class.

Only measurable data generates insights.

After all that rant, let’s try to decipher “logs” data-type.

  1. “Performance Event Logs” generated by an application with fixed fields like {id: number, generated-by: application-name, method: method-name, time: time-since-epoch} is composed of quantifiable fields and constrained schema. So, it belongs to the “Structured Data” class.
  2. “Troubleshooting Logs” generated by an application with fields like {id: number, generated-by: application-name, timestamp: Date-time, log-type: <warn, info, error, debug>, text: BLOB, +application-specific-fields} is composed of quantifiable and non-quantifiable fields, without a constraining schema. Some applications may add additional fields like – API name, session-id, and user-id. Strictly, this is “unstructured” data due to the BLOB but loosely called “semi-structured” data.

Measurement-based data type classification and composition of types into structures do not convey semantics. We will cover semantics in our next blog!

Agile: “Teaming” + “Collaboration”

How to improve the “collaboration” in an agile “team”? Collaboration is a critical ingredient in the pursuit of excellence.

“Agile is for the young who can sprint. What’s the minimum age to apply for a manager? Managers don’t need to sprint.” – Software Engineer

“I need my personal space and can’t work in a collaborative space. I need to hide sometimes. Managers are in a cabin; I want to be isolated too.”Software Engineer

“No pair programming, please. I am most productive when I am alone. I listen to my music and code. I will follow the coding guidelines; just let me be with my code. I will work all night and get it done with great quality – promise. Can I WFH?” – Software Engineer

“You must review your code before check-in. Peer review is like brushing your teeth in the morning. It’s hygiene. Do you brush your teeth every day? Like it or not – just like brushing teeth – you have to peer-review your code before check-in” – Coach.

“You don’t go to the gym to only run on a treadmill for cardio. You have to train your back with pullups, chest with dumbbell incline press, shoulders with machine shoulder press, and biceps with dumbbell bicep curls. Whole-body training gives the best results. In the same way, in the agile gym, you have to practice pair-programming, team retrospectives, team backlog grooming, peer-review, and many more. It’s a team sport. We will start you with pair-programming and then gradually introduce other practices” – Coach.

Software Engineers’ perspective is correct: They have been nurtured by the system to be competitive. They did not work in pairs to clear their engineering exams. Study groups were just boredom killers. They compete with other engineers for jobs. They are where they are because of their “individualism” and not their “collaboration” skills. And, the ask from them is to un-learn all of that and “collaborate.” It’s a value conflict.

Coaches’ perspective is correct: Great things have been achieved with collaboration. From “hunting for food” during cave days to “winning a football (soccer) game” requires intense collaboration.

In sports teams, say, cricket teams, some basic instincts kick in to drive collaboration. People quickly self-organize into the batter, bowler, wicket-keeper, and captain. Batters collaborate to seek “runs.” Everybody gives feedback to bowlers. The team claps when anybody fields the ball. They hug and scream. Emotions flow. They celebrate each other – it’s the team and not the individual. And, when this same team comes back to their desk to work, emotions stop, and they continue complaining about pair programming (2 batters running) and peer review (everybody giving feedback to bowlers).

It’s not about process, practices, and tools. It’s about people. In a team context, it’s an identity loss for the individual. It’s a mistake only to celebrate a team and overlook individualism. “Collaboration” shines when “Individualism” is honored. While there is a cup for the team, there is also a man-of-the-match (or woman-of-the-match). So, it has to be “Teaming,” “Collaboration,” and “Individualism.”

It’s not about leveraging digital collaboration tools. It’s about allowing human emotions to flow in the work context using gaming to simulate a sports environment. Example: Leaderboards in adopting an agile practice, Leaderboards in competency development, Leaderboards in customer NPS, and badges for engineer-of-the-team help pump the adrenaline gene. The gaming process should not be too liberal in the rewarding process and allow good/bad/ugly emotions to flow—Mix western-style gaming by rules and eastern-style gaming by shame. Example: In football (soccer),

  1. Western-style: The yellow card to warn a player is gaming by rules.
  2. Eastern-style: The coach pulling out a non-performing player from the field is gaming by shame.

Agile Manifesto: “Individuals and interactions over processes and tools

For engineers: Don’t treat your team at work like your family. Treat them as your sports team. If you are handicapped for life, the people looking after you is your family and not your team. The team will extend financial/emotional support but cannot replace family. The value systems are different.

For coaches: Use gaming. Use agile. Not just the process. People before process.

Digital Career in Technology

“I am in software, so I am digital,” claims a software engineer. It’s a fallacy.

“What is Digital?” Based upon their experience, the audience may answer as software, computers, workflow, automation, social media, or agile.

“I have converted the paper workflow into a form on the computer. We are now paperless. Everything is digitized and neatly stored in the database libraries.” – Software Product Leader. Behind the scenes a user is complaining – “This computerized documentation is slower than paper”

Digitizing is not Digitalizing

“I have applied for a job in a Digital company. They are into IoT, Cloud, and BIG Data. After I joined, it’s no different than any other software company. It’s just fixing bugs in somebody else’s code! and long working hours.”

Digital is not about software

So, here’s my opinion – Digital is about customer experience and consumerism. Technology and Software (Computers, software, agile, AI/ML, workflow, etc.) play a role, but they are just a means to an end.

“Customer” <<>> “Experience” <<>> “Consumerism”

Story of Mrs. Jane Doe going Digital

Mrs. Jane Doe loves cooking. She believes she makes the best chocolate cookies in the world. She wants to go digital – she wants more people to experience and consume her cookies. A good business is a growing business. A friend tells her about “anything-you-want.com,” where there are a million users registered. She can publish her cookies and her location; the platform has delivery partners that will deliver her cookies anywhere in the world. So, she has only to make yummy cookies and not hire expensive and cranky software engineers!

The results were excellent; there were 100 delivery requests on day-1. Mrs. Jane Doe improved the consumption of her service (cookies). When she went back to the site, 60 users had rated her cookies as 5-star, 30 users had rated her cookies as 4-star, and 10 users had rated her cookies as 2-star with comments as “Too sweet and sugary. Avoid”

Hmmm, more consumption means more feedback (experience ranges from good, bad, ugly). So, in her next iteration, she added customization to her cookies to request reduced sweetness. She observed the next 100 orders, and it looks like she has made an incremental improvement. 65 cookies rated as 5-star and 35 cookies rated as 4-star. She had no objective/subjective data to improve her cookies. There were no comments at all.

She had an idea; she published a discount coupon code with the next order; the discount coupon code would be activated only after a feedback comment. After this incremental change, she observed the next 100 orders, and voila! she had comments (at the cost of giving free cookies). The comments ranged from Boring package, Expected more cookies in the package, same looking and tasting cookies without variety, too hard for my teeth, and too mushy and melting. She was now armed with feedback from a poor experience and ready to make more changes. She was determined to improve her rating! A higher rating means more orders!! So, it’s experience and consumerism. Digital is cool.

Digital is a new way of doing business. Well, it’s the old way that is packaged in a new way, with “technology” as an enabler and accelerator.

So, how does this relate to a career in technology?

Modern technology is architected as a set of services. It’s paramount that the consumption and experience of the service are measured. Measurement and feedback improve the service. Feedback could be defects or improvement opportunities, and addressing them enhances the experience and consumption of the service. Collect data about consumption and experience – logs, click-streams, and user feedback circles. Analyze data to improve the service quality attributes – functionality, reliability, scalability, etc. It’s a digital pursuit to improve a service experience and consumption.

This continuous improvement mindset drives digital. The user/customer is at the center, not technology. Technology is applied to improve the services. Don’t just hear them; listen to the user’s feedback. If the user is a critique, you are lucky. It’s an opportunity to improve. Whether you are building a platform or an application, it’s a service with a user/customer that uses the service. Move away from software to service.

It’s a digital economy powered by services. Digital is customer experience and consumerism.

While striving for technology expertise/excellence, focus on users/customers. You can then add “digital” to your CV.

Data Representation

Data Representation is a complex subject. People have built their careers in data representations, and some have lost their sleep. While the parent post refers to binary and non-binary data, the subject of data representations is more complex for a single blog post. If you are as old as me and lived through the data representation standardization, you will understand. If you are a millennial, you can reap the benefits of painful standardization of data structures. Semantic Data is still open for standardization.

What is Data?

Data is a collection of datum. Datum is singular, and Data is plural. In the computer language, “Data” is also widely (loosely) used as a singular.

A datum is a single piece of information (a single fact, a starting point for measurement). A character, a quantity, or a symbol on which computer operations (add, multiply, divide, reverse, flip) are applied. E.g., The character ‘H’ is a datum, and the string “Hello World” is data composed of different datum characters.

From now on, we will call ‘H’ and ‘Hello World’ as Data.

What are Data Types?

Data types are attributes of data that tell the computer the programmer’s intent to use the data. E.g., If the data type is a number, the programmer can add, multiply, and divide the data. If the data type is a character, then the programmer can compose the characters into strings. The operations add, multiply, and divide do not apply to characters.

Computers need to store, compute, and transfer different types of data.

Some common Data types are best described below that illustrate basic and composite data types:

Data TypesExamples
Characters and Symbols‘A’, ‘a’, ‘$’, ‘‘, ‘छ’
Digits0, 1, 2, 3, 4, 5, 6, 7, 8, 9
Integers (Signed and unsigned)-24, -191, 533, 322
Boolean (Binary)[True, False], [1, 0]
Floats (single precision)-4.5f
Doubles (double precision) -4.5d
Composite: Imaginary Numbersa + b*i
Composite: Strings“Heaven on Earth”
Composite: Arrays of Strings[‘Heaven’, ‘on’, ‘Earth’]
Composite: Maps (key-value){‘sad’: ‘:(‘, ‘happy’: ‘:)’}
Composite: Decimal (Fraction)22 / 7
Composite: Enumerations[Violet, Indigo, Blue, Green, Yellow, Orange, Red]
Table of Sample Data Types

What are Data Representations?

Logically, computers represent a datum by mapping it to a unique number and data as a sequence of numbers. This representation makes computing consistent – everything is a number. This mapping is called “Unicode.”

ExampleNumber
(Unicode code points)
HTMLComments
‘A’U+0041&#650x41 = 0d65
‘a’U+0061&#970x61 = 0d97
8U+0038&#560x38 = 0d56
‘ह’U+0939&#23610x939 = 0d2361
Sample Mapping Table

The numbers can themselves be represented in the base of 2, 8, 10, or 16. The human-readable number is base-10, whereas base-2 (binary), base-8 (octal), and base-16 (hexadecimal) are the other standard base systems. The Unicode code points (mappings) above are represented in hexadecimal.

Base-10Base-2Base-8Base-16
0d25
(2*10 + 5)
0b11001
(1*24 + 1* 23 + 0*22 + 0*21 + 1*20)
031
(3*81 + 1*80)
0x19
(1*161 + 9*160)
Base Conversion Table

Computers use base-2 (binary) to store, compute, and transfer data. Computers use base-2 because the electronic gates that make up the computers use binary inputs. Each storage cell in memory can store “one bit,” i.e., either a ‘0’ or a ‘1’. A group of 8 bits is a byte. The Arithmetic Logic Unit (ALU) uses a combination of AND, OR, NAND, XOR, NOR gates for mathematical operations (add, subtract, multiply, divide) on binary (base-2) representation of numbers. In modern memory systems (SSDs), each storage cell can store more than one bit of information. These are called MLCs (Multi-level cells). E.g., TLCs store 3 bits of information – or – 8 (23) stable states. This MLC helps to build fast, big, and cheap storage.

Historically, there have been many different character sets. E.g., ASCII for English, Windows-1252 (expanded ASCII) used by windows-95 systems to represent new characters and symbols. However, modern computers use the Unicode character set for (structural) interoperability between computer systems. The current Unicode (v.13) character set has 143,859 unique code points and can expand to 1,114,112 unique code points.

While all the characters in a character set can be mapped to numbers, precision point numbers (floats, doubles) are represented in the computers differently. They are represented as a composite of a sign, mantissa (significant), and exponent:

± (mantissa) * 2exponent

DecimalBinaryComment
1.51.11 * 20 + 1 * 2-1
33.25100001.011 * 25 + 0 * 24 + 0 * 23 + 0 * 22 + 0 * 21 + 1 * 20 + 0*2-1 + 1*2-2
Binary Representation of Decimal Numbers

The example below shows how 33.25 is converted to a float (single precision) representation – 1 sign bit, 8 exponent bits, 23 mantissa bits:

Convert 33.25 to Binary100001.01
Normalized Form(-1)0 * 1.0000101 * 25
[ (-1)s * mantissa * 2exponent ]
Convert exponent using biased notation
Represent decimal as binary
5 + 127 = 13210 = 1000 01002
Normalize the mantissa
Adjust to 23 bits by padding 0s
000 0101 0000 0000 0000 0000
Represent the 4 byte (32 bits)0100 0010 0000 0101 0000 0000 0000 0000
Floats (single precision) represented in 4 bytes

Some scientific computing requires double precision to handle the underflow/overflow issues of single precision. Double precision (64 bits) uses 1 sign bit, 11 exponent bits, and 52 mantissa bits. There are also long doubles that store 128 bits of information. The arithmetic operations (add, multiple) in the electronics are simplified using this binary representation.

Despite great computer precision, some software manages decimals as two separate fields (numerator and denominator) or (before . and after .) as multi-byte integers. These are called “Fraction” or “Decimal” data types and are usually used to store “money” where precision loss is unacceptable (i.e., 20.20 USD is 20 Dollars and 20 cents and not 20 Dollars and 0.199999999999 dollars).

What is Data Encoding?

Encoding is converting data represented by a sequence of numbers from the character set mapping into bits and bytes. The encoding process could be fixed width or variable width and is used for storage/transfer of data. Base64 encoding uses a fixed width (8 bits) encoding to represent 64 ASCII characters (A-Z, a-z, 0-9, special characters). UTF-8 encoding uses a variable width (1-4 bytes) encoding to represent Unicode character set.

TextBase64UTF-8
earthZWFydGg=01100101 01100001 01110010 01110100 01101000
éarthw6lhcnRo11000011 10101001 01100001 01110010 01110100 01101000
Base 64 encoding resulted in fixed-length representations, and UTF-8 resulted in variable-length representations. UTF-8 optimizes for the ASCII Character set and adds additional bytes for other code points. The character ‘ é ‘ is encoded into two bytes ( 11000011 10101001 ). This variable-length encoded sequence can be decoded because there is no conflict during the decoding process.

Base64 is usually used to convert binary data for media-safe data transfer. E.g., A modem/printer would interpret binary data differently (sometimes as control commands), so a base64 encoding is used to convert the data into ASCII to be media-safe. The Data is transferred as binary; however, since the bytes are ASCII (limited binary), the media/printer is not confused. If you observe, base64 has increased the number of bytes after the encoding. Earth (5 bytes) is encoded as ZWFydGg= (8 bytes). The Data is decoded back to binary at the receiver’s end. The example below shows the process:

1earth (40 bits)01100101 01100001 01110010 01110100 01101000
2Buffer to have bits in the multiples of 6 at byte boundaries (48 bits) [48 is 6 bytes and a multiple of 6]01100101 01100001 01110010 01110100 01101000 00000000
3Regroup into 6 bit bytes011001 010110 000101 110010 011101 000110 100000 000000
4Use Base64 table to map to text (see Wikipedia for base64 map)ZWFydGg=
5Convert to binary to send to store or transfer01011010 01010111 01000110 01111001 01100100 01000111 01100111 00111101

There are many different types of encodings – UTF-7, UTF-16, UTF-16BE, UTF-32, UCS-2, and many more.

What is Data Endianness?

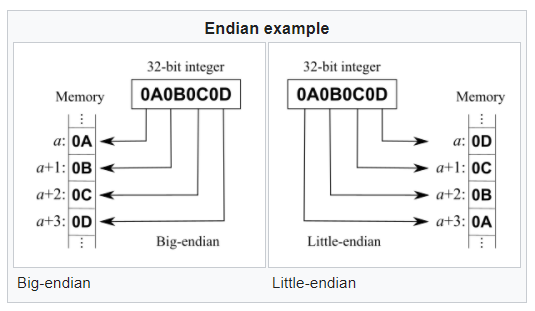
Endianness is the order of bytes in memory/storage or transfer. There are two primary types of Endianness: big-endian and little-endian. You might be interested in middle-endian (mixed-endian), and you can google that on your own.

As you can see in the diagram below, the computer may represent the data starting with the most significant byte (0x0A) or the least significant byte (0x0D).

Courtesy: Wikipedia

Most modern computers are little-endian when they store multi-byte data. Networks are consistently big-endian. So, little-endian memory dumps have to arrive at the network as big-endian.

Summary: There are many data types – basic (chars, integers, floats) and composite (arrays, decimals). Data is mapped to numbers using a universal character set (Unicode). This Data is represented as a sequence of code points in Unicode and converted into characters (or bits/bytes) using an encoding process. The encoding process can be fixed-length (E.g., Base64, UTF-32) or variable length (UTF-8, UTF-16). Computers can be little or big-endian. Modern CISC computers (Intel x86) are little-endian, and RISC computers (ARM Processors) are big-endian. Networks are always big-endian.

Tips/Tricks: Stick to Unicode character set and UTF-8 encoding scheme. Use Base64 to transfer data to be media-safe (e.g., base64 encoding of strings in HTTP URLs to make them URL-safe). Using a modern programming language (E.g., Java) abstracts you from the Endianness. If you are an embedded engineer programming in C, you need to develop code to be Endianness safe (e.g., type casts and memcpy).

Even with all this structure, we cannot convey meaning (semantics). An ‘A’ for the computer is always U+0041. If the programmer wants to transfer ‘A,’ ‘A,’ or ‘A,’ more information is encoded for the receiver to interpret. More on that in future blogs.

This one was too long even for me!

Agile Team Composition – Inequality Lens

This is a very opinionated post. More opinionated than some of my previous posts. This post is not about roles in a team (scrum master, product owner, developer, tester) or supporting structures (product management, architecture, DevOps) or in/outsourcing members. This post is also not about the skill homogeneity (homogenous, heterogenous) of an agile team. This post is about the inequality (experience and salaries) of team members within an agile team.

It’s common sense that the team should be composed of skills required to do the job and roles to perform functions. These two are necessary ingredients for a good scrum team.

If you are building a data lake, you need data engineers (competencies/skills). But, data engineer experience ranges from 1-year experience to 20 years of experience. The salary ranges from 5L INR/USD to 45L INR/USD. So, how do we compose teams?

Some unwritten industry rules:

Rule A: The more experienced you are, the expectation moves from being hands-on on a single project to a mentor/coach for multiple projects. A mentor/coach competency is different from engineering a product (hands-on) competency. Adding to the irony, nobody respects a coach who is not hands-on (unlike a sports coach). Salary expectations from experienced individuals also drive this.

Rule B: The more experienced you are, the expectation moves from being a developer/tester to a scrum master, lead engineer, or architect. Many engineers hop jobs to seek out these opportunities. It’s a crime to be a developer/tester for life. The industry critically judges life-long developers/testers (there is nothing wrong with it if your passion is to build). All engineers face the dilemma of salary growth driven by opportunities in contrast to their core skills and passions. That’s life.

Rule C: The less experienced you are, the industry wants to pay you less than your experienced counterparts, irrespective of your skills and credentials. The expectation is that you are a worker bee and not a leader bee, regardless of your leadership credentials. There are exceptions, but the norm is to classify you into developer/tester class. The manager says: “Work your way up.” It’s like the harry potter sorting hat @ work automatically sorting you first by experience and then by credentials.

Agile (with its egalitarian view) challenges this status-quo. Treat everybody equally says agile. How?

In reality, a pay disparity within a team auto-magically drives a command-control structure. Salaries are usually an open secret. This new agile egalitarian structure drives people to respect each other as equals on the surface, but not in spirit.

“Who wins? Capitalist or Socialist? The capitalist, of course,” is the shout-out from the management coach. “That’s the only thing that has worked for humanity.”

With this in-spirit inequality, the agile coach commands: “Self-organize yourself.” The two-year-old experienced software engineer is scared to take the (tie-suit) role of product owner, and the (tie-suit) product owner cannot massage her ego enough to do the developer role. This structure is the new corporate caste system.

Critics of agile target this egalitarian view. Committees cannot make decisions. You need an escalation and decision structure with “one” accountable neck to chop.

An example that works: The five founders of a company working with agile principles to self-organize themselves for the company’s success. There is an in-built expectation that the scale of investment (money, time) drives eventual profits.

Counter Example: A software development team with an experience pyramid working with agile principles to self-organize themselves for the group’s success. People will stick to their roles and view team success from the specific role lens that they own. Scrum masters to drive agile values (huh! no they are just trackers), Product owners to bring requirement clarity, architecture owners to bring design clarity, and engineers to build. Agile purists say that self-organizing means pulling and sharing work and has nothing to do with roles. I disagree; there is more to it! Roles define work types. It’s a culture change that is hard to achieve with in-built in-equality.

It’s human nature to accept the new corporate caste system and reject the religious ones.

Somewhere the capitalist is laughing: “Want to make more money? Take risks and Lead. I will invest, and you will still serve me. Ha ha ha. Money makes more money. So, make more money to make more and more money. Structures exist to control, and deliberately unequal. Welcome to my caste system. Do or die

Finally, after all that rant, My opinion: A purist agile egalitarian approach is not practical in our current world-view. A team must be composed of people with an experience pyramid with a minimum expectation of mutual respect. In a mature team composed of members (not driven by salaries and opportunity, but by a shared vision), self-organization is more practical, but it’s not the norm. A shared vision is not a norm; the expectation of a shared vision is. The leader drives the vision, and teams share the responsibility to deliver the vision. Capitalistic values drive new world order where in-built in-equality is tolerated as an acceptable tradeoff.

Some day we will grow out of this one too; or become a capitalist.

Delegation

Ask, Don’t tell :::: Tell, Don’t Ask :::: Don’t Ask, Don’t Tell

For those of us in software, we know about the two programming paradigms that are used widely in the industry – Object-Oriented and Functional. The object-oriented paradigm is usually termed as the “Tell, Don’t Ask” model, where the data and behavior are kept together. The functions in the object-oriented paradigm change state of the object (i.e., cause side effects). The functional paradigm is usually termed the “Ask, Don’t Tell” model, where the functions don’t change state and cause no side effects. The software security implementations favor the “Don’t Ask, Don’t Tell” – or weakly the principle of least privileges.

These software models are just copied over from the management/leadership principles. It’s all about delegation.

  1. Tell, Don’t Ask: Delegates responsibility and authority.
  2. Ask, Don’t Tell: Does not delegate responsibility or authority.
  3. Don’t Ask, Don’t Tell: Intentional Non-transparency.

The management coaches will scream: “You should delegate responsibility, but not accountability.”

The agile coaches will correct the statement: “You should delegate responsibility and authority, but not accountability.”

This one everybody agrees – The accountability lies squarely on the first line leader a.k.a. the project manager. However, the project manager is encouraged not to micro-manage but to delegate responsibility and authority to the scrum teams.

Not all scrum teams are alike because not all people are alike and have different natures (due to the nature/nurture mix) that drive their behaviors. Some people follow commands, whereas others question the status quo. Some people focus on problems, and others focus on solutions. When a scrum team is formed, and people with different backgrounds are put together, delegating responsibility and authority can be challenging. Some scrum teams will accept responsibility but will defer the authority to the leadership. Other scrum teams will not accept responsibility without authority.

Example: The architect is accountable for defining the architecture, and the scrum team is responsible for implementing the architecture. In this model, responsibility is delegated, but the authority to make architectural choices are not. Depending on the culture (largely nurture) you come from, the scrum teams would be either happy or revolt.

Not all people are made equal or nurtured equally. Some people have lived prosperously and always made their choices. Others have lived in a command control structure and always had to make the commander’s choice their own. When people of different natures are put together in a scrum team, the team takes a while to form, norm, and perform. Delegating to such scrum teams takes patience.

Hence, agile coaches ask not to break the scrum teams. Don’t allocate people to projects; assign projects to scrum teams. This principle also means that we don’t treat people like resources (i.e., people resources allocated to projects, but we assign projects to people teams). So, treat people like people (just like you treat code like code and infrastructure as code).

Summary: The project manager must delegate responsibility and gradually delegate authority (depending upon the scrum team the project manager has to deal with). Delegating authority creates an egalitarian environment that people (even from working democracies) will need to adapt.

Activities vs. Outcomes

The operation is successful but the patient died – A day in life of a doctor

It’s classic. The outcome expected by the patient’s relatives from a heart surgery is that the patient’s condition improves. The surgical team performs many activities (wheeling the patient into the surgery room, anesthesia for the patient, monitoring vitals, and many more) pre-operative, intra-operative, and post-operative. Eventually, If the patient does not recover, the team will still claim that all the activities were successful.

Successful activities don’t necessarily lead to a successful outcome. Successful activities are necessary but not a sufficient condition.

In a software development context, to reach a goal, a team performs many activities. They may spend many sprints busily doing activities. The burn charts will show that work is being done and accepted, but alas, the outcome may not be in sight for many months. In Agile, we break down a business EPIC into Features, Features into Stories, and perform tasks to claim a story. The customer (or proxy) defines the outcome in the EPIC, and the acceptance of features, stories, and tasks are just activities. Successful completion of the features, stories and tasks does not guarantee a successful outcome.

The Feature burn charts look good, and teams like to showcase these charts to demonstrate progress. Progress is necessary but not sufficient for an outcome.

A few things can happen when the team completes all the features in an EPIC

  1. Successful Outcome: The team accepts all features of an EPIC, and the customer (or proxy) accepts the EPIC.
  2. Partial Successful Outcome: The team accepts all features of an EPIC, and the customer (or proxy) gives new inputs or flags issues to the team. The EPIC is not accepted, and issues are added to the EPIC, or the existing EPIC is accepted, and new EPICs are created to handle new inputs (scope increase).
  3. Failed Outcome: The team accepts all features of an EPIC, and the customer (or proxy) does not accept the EPIC, and the team has to significantly re-plan.

If the customer (or proxy) is engaged continuously, #3 is an anomaly, but it can happen. A Partial successful outcome (#2 above) would be the most likely outcome unless the EPIC were very well defined, tiny, and non-ambiguous. But we are agile to deal with ambiguities. To handle new features (scope creep), the teams create a new EPIC V2.0. To handle issues (bugs), the teams create issues in the EPIC and plan to close this debt (at least some of them) before new features are prioritized, and the EPIC can be (reasonably) accepted.

Going back to our heart surgery, the team may have planned the exact features in the surgery (e.g., Stent the artery), but during the surgery, they may find anomalies that need to be taken care of other than just stenting the artery. These anomalies take time (effort) to fix, and the surgery time may increase. The surgeon may also detect anomalies that might require a new surgery (new EPIC) to handle during the surgery. After the surgery, the patient may have BP stability issues (hypotension) and is on NOR (Norepinephrine) to maintain blood pressure and stabilized in the ICU before being discharged (discharge: A successful outcome).

Summary: Activities lead to outcomes. This activity completion is necessary but not sufficient. Successful activities may lead to failed outcomes. Organizing and Planning work (in EPICs/Features/Stories) is important for efficiency and predictability. However, in most practical cases, things go wrong. Sometimes, more work has to be done that causes the effort in a feature to shoot up, OR more work has to be done before a feature can be claimed to be done, OR new requests prop up after an EPIC is claimed.

There is a need to separate “organizing work” and “seeking outcomes” so that both efficiency metrics (lead metrics: say/do) and outcome metrics (lag metrics: KPIs) are tracked.

Data about Data

As a Data Engineer, I want to be able to understand the data vocabulary, so that I can communicate about the data more meaningfully and find tools to deal with the data for computingData Engineer

Let’s start with this: Binary Data, Non-binary Data, Structured Data, Unstructured Data, Semi-structured Data, Panel Data, Image Data, Text Data, Audio Data, Categorical Data, Discreet Data, Continuous Data, Ordinal Data, Numerical Data, Nominal Data, Interval Data, Sequence Data, Time-series Data, Data Transformation, Data Extraction, Data Load, High Volume Data, High Velocity Data, Streaming Data, Batch Data, Data Variety, Data Veracity, Data Value, Data Trends, Data Seasonality, Data Correlation, Data Noise, Data Indexes, Data Schema, BIG Data, JSON Data, Document Data, Relational Data, Graph Data, Spatial Data, Multi-dimensional Data, BLOCK Data, Clean Data, Dirty Data, Data Augmentation, Data Imputation, Data Model, Object (Blob) Data, Key-value Data, Data Mapping, Data Filtering, Data Aggregation, Data Lake, Data Mart, Data Warehouse, Database, Data Lakehouse, Data Quality, Data Catalog, Data Source, Data Sink, Data Masking, Data Privacy

Now let’s go here: High volume time-series unstructured image data, High velocity semi-structured data with trends and seasonality without correlation, High volume Image data with Pexels Data source masked and stored in Data Lake as the Data Sink.

The vocabulary is daunting for a beginner. These 10 categories (ways of bucketizing) would be a good place to start:

  1. Data Representation for Computing: How is Data Represented in a Computer?
    • Binary Data, Non-binary Data
  2. Data Structure & Semantics: How well is the data structured?
    • Structured Data, Unstructured Data, Semi-structured Data
    • Sequence Data, Time-series Data
    • Panel Data
    • Image Data, Text Data, Audio Data
  3. Data Measurement Scale: How can data be reasoned with and measured?
    • Categorial Data, Nominal Data, Ordinal Data
    • Discreet Data, Interval Data, Numerical Data, Continuous Data
  4. Data Processing: How is the data processed?
    • Streaming Data, Batch Data
    • Data Filtering, Data Mapping, Data Aggregation
    • Clean Data, Dirty Data
    • Data Transformation, Data Extraction, Data Load
    • Data Augmentation, Data Imputation
  5. Data Attributes: How can data be broadly characterized?
    • Velocity, Volume, Veracity, Value, Variety
  6. Data Patterns: What are the patterns found in data?
    • Time-series Data Patterns: Trends, Seasonality, Correlation, Noise
  7. Data Relations: What are the relationships within data?
    • Relational Data, Graph Data, Document Data (Key-value Data, JSON Data)
    • Multi-dimensional Data, Spatial Data
  8. Data Storage Types:
    • Block Data, Object (Blob) Data
  9. Data Management Systems:
    • Filesystem, Database, Data Lake, Data Mart, Data Warehouse, Data Lakehouse
    • Data Indexes
  10. Data Governance, Security, Privacy:
    • Data Catalog, Data Quality, Data Schema, Data Model
    • Data Masking, Data Privacy

More blogs to deep dive into each category and the challenges involved. Let’s peel this onion.

Tunnel Vision

When I drive through a tunnel with my kid, there are two points of excitement – entry point and exit point. When entering a new tunnel, it’s always a “Yay!!” The exit feeling depends on how long we were inside. It’s either the expression – “Finally some light” or “Oh, no, we are out.”

You get my point. We love tunnels. We like to see the light at the end of the tunnel.

We not only love tunnels, but we love to tunnel. Tunneling helps us focus, and there is a focus threshold after which we need to see some light.

Sprinting in agile is Tunneling. After a two-week sprint, we might have the expression, “Oh, no, we are out too soon.”, and after a four-week sprint, we might have the expression, “Finally, some light.”

A two weeks sprint seems to be a global average of adequate time in a sprint. While that is an indicator, the team must choose their sprint duration.

Not all people are alike. Some people like to be first finishers – Tunneling helps them to get from A to Z fastest. However, we remember our journeys for unplanned explorations. Can we visit that lake nearby? Can we bathe in that waterfall? Can we take a different road?

In software projects, the expectation from engineers/architects is that they build a path from point A to Z as fast as possible (tunnel), but the way should be open to exploration by the user. E.g., Build a mobile user interface to update my health parameters, but let me explore new services in the user interface to improve my health.

If you are agile, you can introduce innovation experiments to explore users unwritten needs, making your own journey not feel like a long tunnel.

Takeaway: We need black-box tunnels, exciting tunnels, and open roadways, and in agile software parlance, that loosely equates to sprints, spikes, and MVPs.